

10 Best Data Analysis Software for Research
This post may contain affiliate links that allow us to earn a commission at no expense to you. Learn more

Discover the Ultimate Data Analysis Software! Unleash the Power of Research with the Best Data Analysis Software for Research for Maximizing Efficiency!
In today’s data-driven world, researchers often struggle to make sense of vast amounts of information. Manual analysis can be time-consuming and error-prone, hindering progress and valuable insights.
Imagine spending hours poring over spreadsheets, struggling to find patterns or make meaningful conclusions. Frustration mounts as deadlines approach, and the pressure to deliver accurate results intensifies.
But fear not! The solution lies in embracing the best data analysis software for research. These 10 powerful tools empower researchers to efficiently analyze data, unravel hidden patterns, and extract valuable insights with ease.
Say goodbye to tedious manual analysis and unlock the full potential of your research endeavors.
Table of Contents
Top 10 Data Analysis Software for Research: In A Nutshell (2023)
#1. ibm spss statistics – powerful statistical software platform.
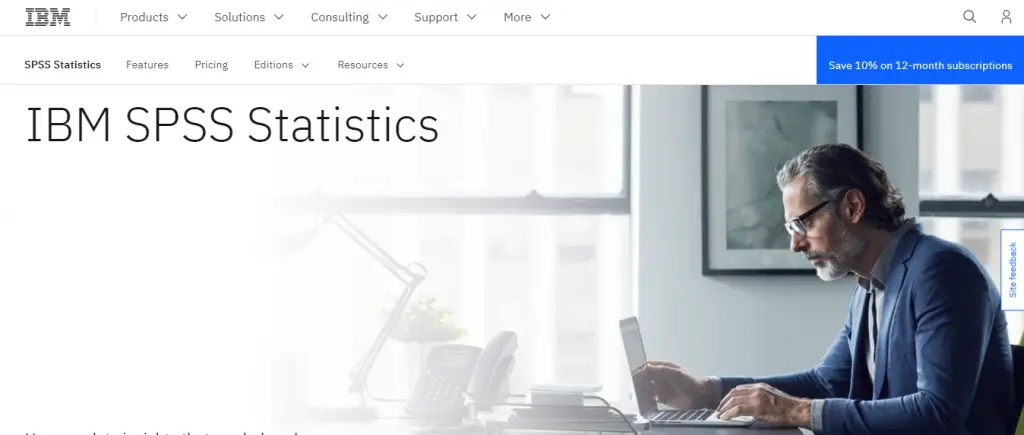
IBM SPSS Statistics is a renowned data analysis software widely chosen by researchers for its robustness and versatility. It offers a comprehensive suite of tools for data management, exploratory data analysis, hypothesis testing, and predictive modeling.
Its intuitive interface simplifies the data analysis process, making it efficient and time-saving. With a wide range of statistical techniques, it caters to both basic and advanced research studies.
However, users should be cautious about its resource-intensive nature, requiring powerful computer systems to handle large datasets. Additionally, the software’s licensing cost can be high, posing financial challenges for some researchers.
While IBM SPSS Statistics is generally reliable, occasional compatibility issues with operating systems or other software have been reported. Staying updated with the latest software versions and checking for known issues can help alleviate such problems.
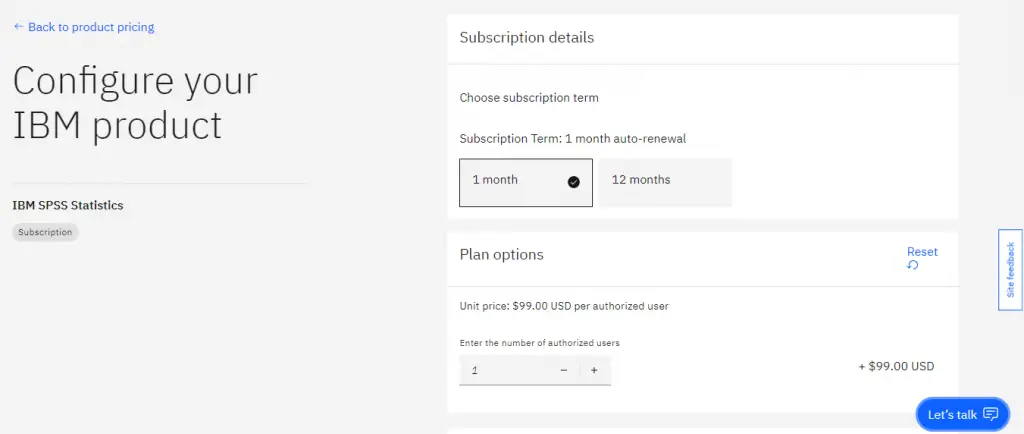
- Monthly: $99
- Yearly: $1069
#2. SAS – Analytics, Artificial Intelligence and Data Management software
SAS (Statistical Analysis System) is a widely-used data analysis software tool favored by researchers across disciplines. Its robustness, reliability, and comprehensive suite of statistical analysis and data management capabilities make it a top choice for professionals in academia and industry.
With advanced data manipulation and integration features, SAS enables users to effectively analyze and interpret complex data sets.
While SAS offers numerous benefits, there are a few considerations to keep in mind. The software has a steep learning curve, requiring some programming knowledge and time to master.
Additionally, SAS can be expensive due to licensing costs, which may pose budget constraints for individual researchers or smaller organizations.
Compatibility limitations with other software tools and data formats, as well as less intuitive and visually appealing graphical capabilities for data visualization, are some known issues with SAS.
Despite these considerations, SAS remains a reliable and versatile tool for researchers, offering a comprehensive set of analytical capabilities to derive meaningful insights from data.
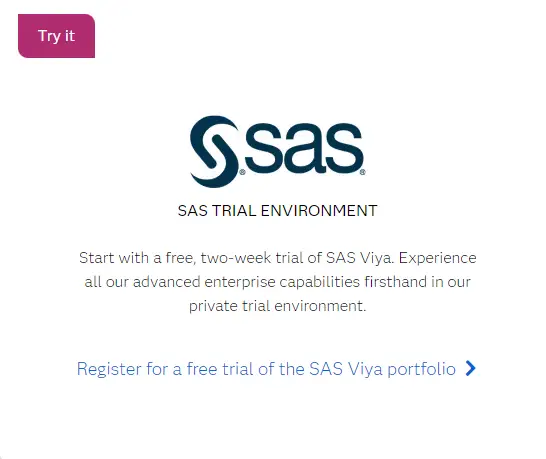
- Pricing plans of SAS are not publicly available, you need to sign up for a free trial.
#3. MATLAB – High-performance language for technical computing
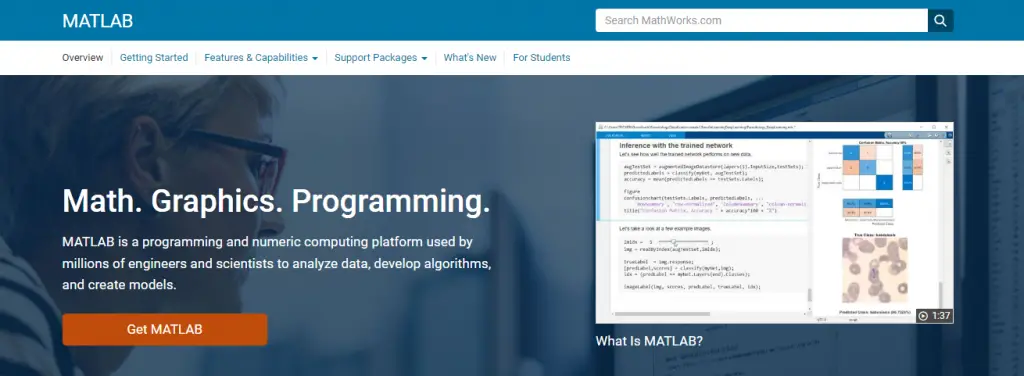
MATLAB is a highly regarded data analysis software used by researchers in diverse fields. Its popularity stems from its powerful features and user-friendly interface.
With an extensive library of built-in functions and toolboxes, MATLAB enables users to perform complex computations, statistical analysis, and data visualization effortlessly. Its compatibility with various file formats allows seamless integration of data from different sources.
Researchers value MATLAB for its versatility in handling diverse research needs, from exploratory data analysis to machine learning algorithms. The software’s ability to process large datasets swiftly and its interactive programming environment facilitate rapid prototyping and debugging.
However, potential users should be aware of the licensing cost, which may be a limiting factor for those on a tight budget, and the learning curve associated with mastering the syntax and advanced features of MATLAB.
Despite occasional memory limitations and slower performance for certain functions, MATLAB remains an indispensable tool for researchers, offering comprehensive functionality and a vast community of users for support.
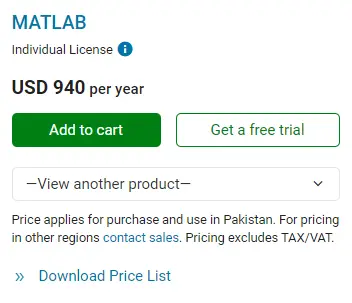
- The individual License of MATLAB costs $940.
#4. Stata – Statistical software for data science
Stata is a highly regarded data analysis software widely used in research due to its extensive statistical tools and user-friendly interface.
Researchers appreciate Stata’s versatility, as it supports various data formats and offers a comprehensive range of statistical models and techniques for analyzing complex datasets. Its intuitive command syntax and robust documentation make it easier to replicate and share research findings.
However, there are a few aspects to consider when using Stata. It can be quite expensive, particularly for individual users or small research teams with limited budgets.
Additionally, while Stata covers a wide range of statistical capabilities, it may not be the most suitable choice for specialized analyses that require niche software packages.
Some users have also raised concerns about compatibility with other software programs and occasional issues with data handling and memory management.
Nonetheless, Stata remains popular among researchers due to its comprehensive features, user-friendly interface, and strong user community support.
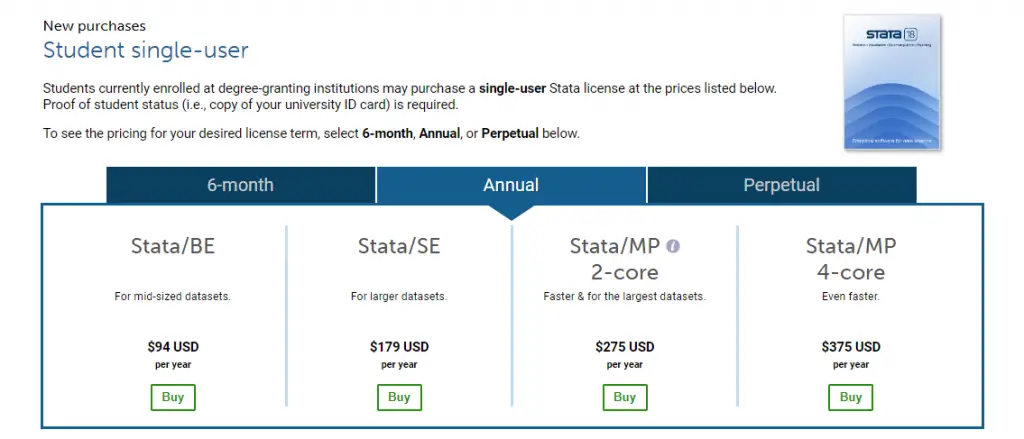
- Stata/BE: $94
- Stata/BE: $179
- Stata/MP 2-core: $275
- Stata/MP 4-core: $375
#5. Tableau – Understand your data
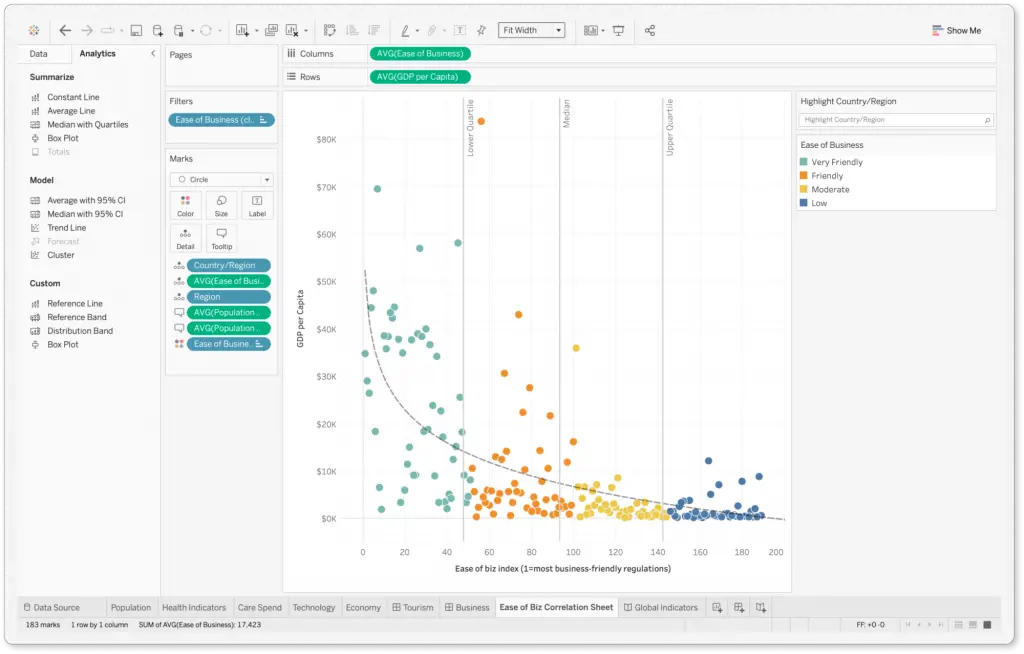
Tableau is a powerful data analysis software that has transformed research with its intuitive interface and comprehensive features. It simplifies complex datasets, allowing researchers to uncover hidden patterns and gain insights.
With its drag-and-drop functionality, Tableau enables users to create visually appealing visualizations without coding skills. It supports various data sources, offers extensive data manipulation options, and facilitates collaboration for team-based research projects .
While Tableau is highly regarded, users should be cautious when working with large datasets as it may impact performance and require significant computational resources. Customization beyond its built-in capabilities can also be challenging.
However, Tableau’s ability to simplify data analysis and present insights in a visually compelling manner makes it a popular choice among researchers.
Continuous updates and a strong community support system ensure that Tableau remains a valuable tool for unlocking the full potential of research data.
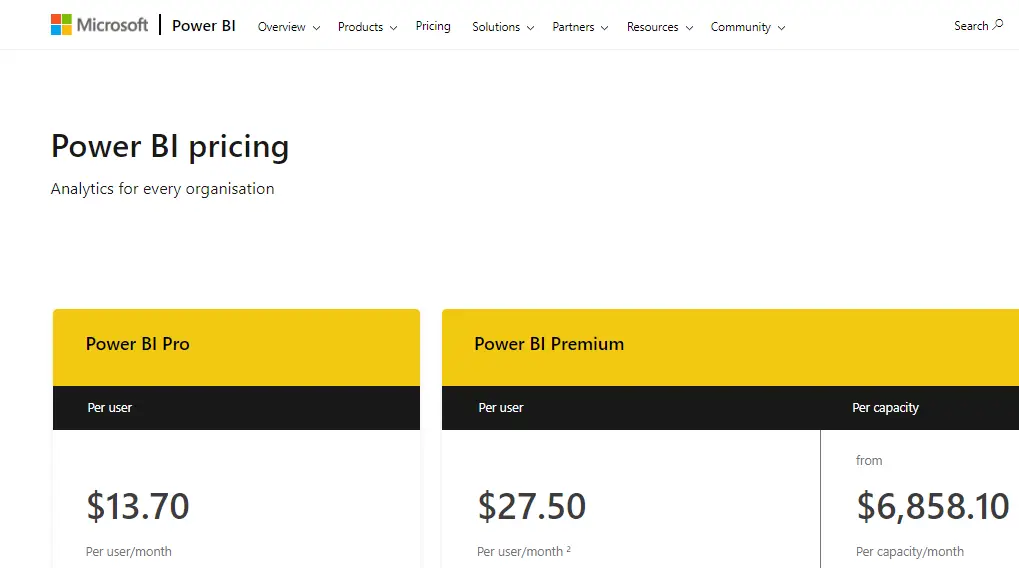
- Tableau Cloud (Hosted by Tableau) – $70 monthly for every user which is billed annually.
- Tableau Server (On-Premise) – $70 monthly for every user which is billed annually.
#6. PowerBI – Get the most out of your data
How to use Microsoft Power BI – Tutorial for Beginners
PowerBI is a widely acclaimed data analysis software that has gained popularity among researchers and data enthusiasts. Its user-friendly interface and powerful features make it a top choice for analyzing and visualizing complex datasets.
PowerBI is highly regarded for its ability to handle large amounts of data and generate insightful reports and interactive dashboards.
With seamless integration with various data sources, including databases and spreadsheets, researchers can effortlessly consolidate and transform data into meaningful visualizations and actionable insights.
However, users should be aware of the learning curve associated with PowerBI, especially for individuals new to data analysis. Additionally, while the free version has limited capabilities, the full suite may require a subscription, which can be a consideration for those on a budget.
Despite occasional performance and stability issues, PowerBI remains an invaluable tool for researchers, offering a comprehensive suite of data analysis and visualization features.
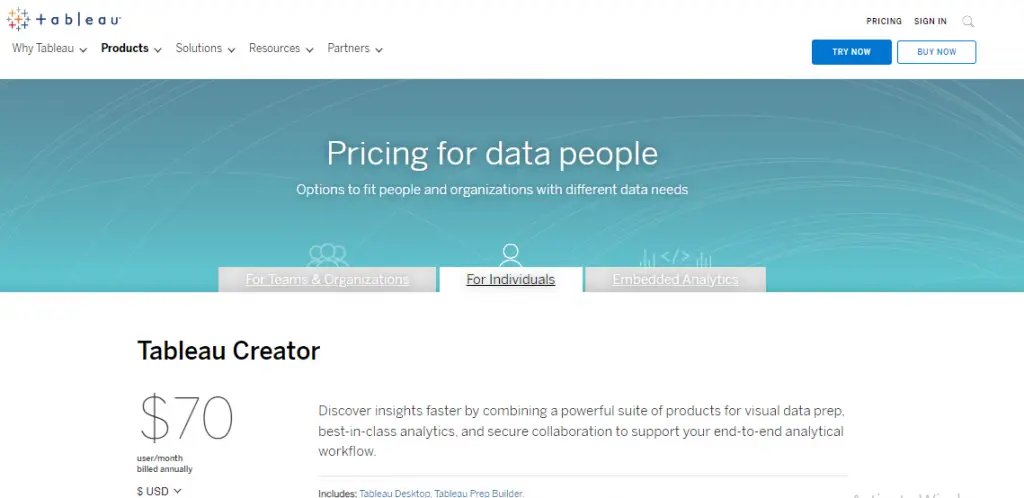
- Power BI Pro ($13.70 per user/per month)
- Power BI Premium ($27.50 per user/per month)
- Power BI Premium ($6,858.10 per capacity/per month)
#7. QDA Miner – Qualitative data analysis software
QDA Miner is a popular data analysis software tailored for qualitative research . Its user-friendly interface and powerful features make it a top choice for researchers seeking to analyze and interpret qualitative data.
With the ability to handle diverse data types and a range of tools for coding and analysis, QDA Miner enables users to extract meaningful insights effortlessly.
Customizable coding schemes, complex query capabilities, and visualization options like word clouds and concept maps further enhance the data interpretation process.
However, it’s worth noting that QDA Miner may have a steeper learning curve for inexperienced users. Some occasional glitches and performance issues have also been reported, although they are typically minor and infrequent.
Despite these considerations, QDA Miner remains a reliable and flexible tool for qualitative data analysis, empowering researchers to effectively explore and interpret their data.
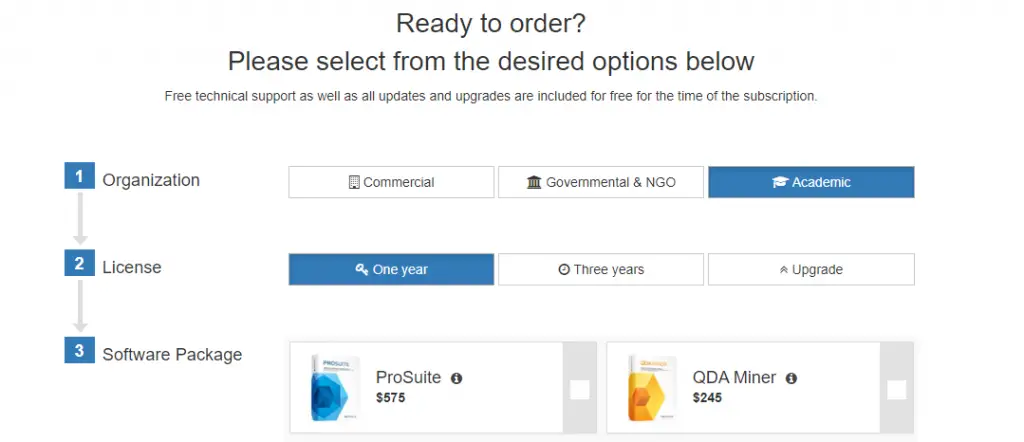
- The pricing details for QDA Miner may vary based on the specific version and licensing options. However, for academic research its cost is $245.
#8. JMP – Visual statistical data analysis software
JMP is a popular data analysis software widely used in research due to its user-friendly interface and robust capabilities. It offers a comprehensive set of tools for exploring and visualizing data, allowing researchers to uncover patterns and make data-driven decisions.
With a focus on exploratory data analysis, JMP enables users to manipulate and visualize data dynamically, making it suitable for a diverse range of research projects.
However, new users may need time to master the advanced features, and occasional performance issues have been reported with large datasets or complex analyses.
Despite these considerations, JMP remains a preferred choice for researchers, thanks to its extensive analysis capabilities, interactive visualizations, and statistical modeling features.
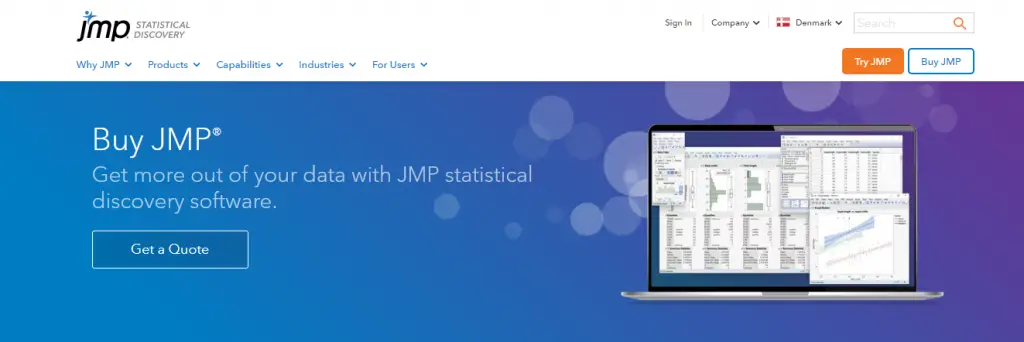
- Pricing plans for JMP aren’t publicly available, you need to contact their sales team to get a quote.
#9. NVivo – Qualitative research software
NVivo is a leading data analysis software designed specifically for research purposes, particularly qualitative research. With its intuitive interface and extensive range of features, NVivo empowers researchers to efficiently explore, organize, and derive meaningful insights from unstructured data.
It offers powerful coding and categorization tools, enabling users to analyze large volumes of data, identify patterns, and create comprehensive frameworks. The software also provides advanced visualization options for data interpretation and presentation.
However, potential users should be aware of a few considerations. NVivo has a steep learning curve, requiring time and effort to fully grasp its functionalities, especially for beginners.
Careful project planning and adherence to consistent coding conventions are important to avoid complications and inconsistencies in data analysis.
Some users have reported occasional performance issues, particularly with large datasets, so it is recommended to use a well-equipped computer system for optimal performance.
Regular software updates and technical support from NVivo’s team are essential for resolving known issues and maximizing the software’s potential. Despite these considerations, NVivo remains a highly regarded and valuable tool for research data analysis.
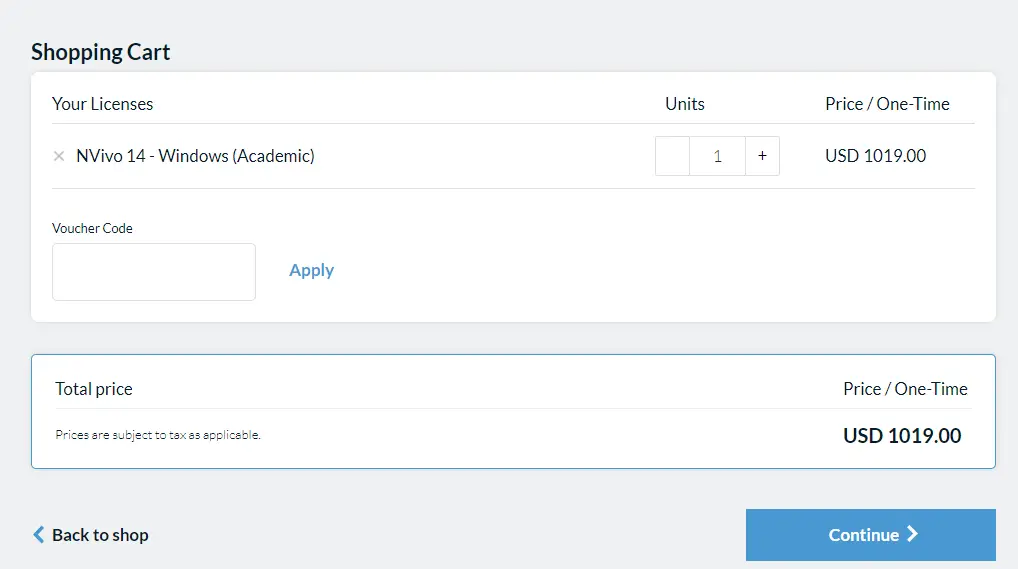
- The cost of the NVivo License is $1,019.
#10. MAXQDA – All-In-One tool for qualitative data analysis
MAXQDA is a widely acclaimed data analysis software used by researchers across various fields. With its user-friendly interface and comprehensive features, it has become a go-to tool for qualitative and mixed-methods research.
MAXQDA offers efficient management, coding, and analysis of diverse data types, including text, images, audio, and video. Its tools, such as word frequency analysis and advanced visualizations, enable researchers to extract valuable insights from their data.
The software’s flexibility and adaptability make it suitable for both beginners and experienced researchers, and its team-based functionalities facilitate collaboration.
However, users should be aware of the learning curve associated with MAXQDA and occasional glitches or slow performance when dealing with large datasets. Overall, MAXQDA empowers researchers to efficiently analyze their data and gain meaningful insights for their research projects.
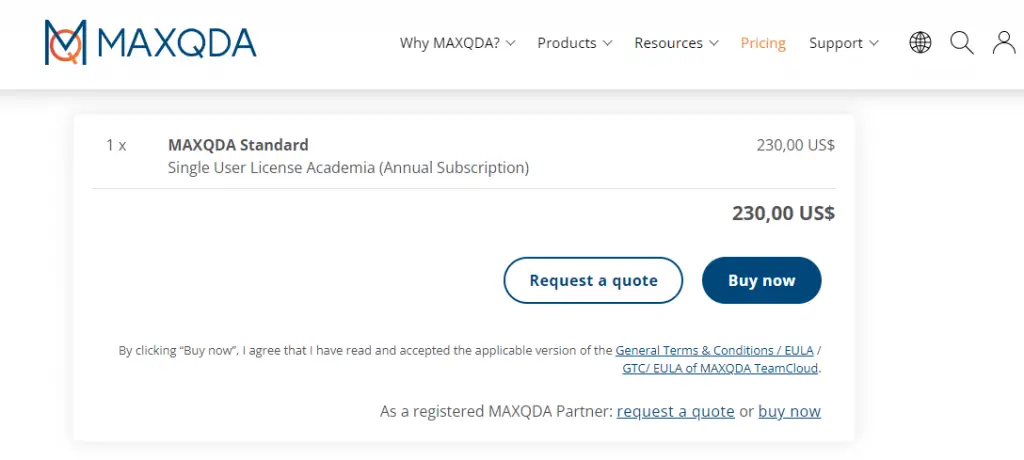
- MAXQDA Single User License Academia Annual Subscription cost is $23,000.
Key Features of Data Analysis Software for Research
Key features of data analysis software for research can vary depending on the specific needs and requirements of the research project. However, here are some key features commonly found in data analysis software that are useful for research:
- Data Import and Integration: The software should allow easy importing and integration of data from various sources, such as spreadsheets, databases, and other file formats. It should support different data types and handle large datasets efficiently.
- Data Cleaning and Preprocessing: The software should provide tools for data cleaning and preprocessing tasks, including handling missing values, removing duplicates, transforming data, and dealing with outliers. These features are crucial for ensuring data quality before analysis.
- Statistical Analysis: The software should offer a wide range of statistical analysis methods, such as descriptive statistics, hypothesis testing, regression analysis, ANOVA, time series analysis, and more. It should provide a comprehensive set of statistical tools to explore and analyze data effectively.
- Data Visualization: The software should include powerful data visualization capabilities, enabling researchers to create charts, graphs, plots, and interactive visualizations to explore and communicate their findings effectively. It should support customization options and provide a variety of visualization types.
- Machine Learning and Predictive Analytics: For more advanced research, the software should incorporate machine learning algorithms and predictive analytics capabilities. This allows researchers to build models, perform classification, clustering, and prediction tasks, and gain insights from complex datasets.
- Reproducibility and Documentation: The software should support reproducibility by allowing researchers to document their analysis steps, code, and workflows. It should provide features for creating reports, annotations, and generating automated documentation, ensuring transparency and facilitating collaboration.
- Data Security and Privacy: Research data often contains sensitive and confidential information. The software should prioritize data security and privacy, providing encryption options, access controls, and compliance with relevant regulations such as GDPR or HIPAA.
- Collaboration and Sharing: The software should facilitate collaboration among researchers, allowing them to share datasets, analyses, and findings with team members. It should support version control, real-time collaboration, and the ability to share results in various formats for easy dissemination.
- Extensibility and Integration: The software should have an extensible architecture, allowing researchers to integrate custom algorithms, scripts, or programming languages. It should provide APIs or scripting interfaces for customization and seamless integration with other tools.
- Support and Documentation: Lastly, the software should have reliable customer support and documentation resources, including tutorials, user guides, forums, and online communities. Regular updates and bug fixes ensure the software remains reliable and up-to-date.
Final Thoughts
In conclusion, when it comes to the best data analysis software for research, there are several excellent options available.
These 10 software tools provide researchers with the necessary features and capabilities to efficiently analyze and interpret complex data sets, enabling them to derive meaningful insights and make informed decisions.
Some of the top contenders in this field include software packages such as R, Python (with libraries like NumPy and pandas), SAS, and SPSS. Each of these tools offers a unique set of advantages, ranging from robust statistical analysis capabilities to extensive data visualization options.
Ultimately, the choice of the best data analysis software depends on the specific research requirements, the user’s level of expertise, and the nature of the data being analyzed.
Researchers should carefully evaluate their needs and consider factors such as ease of use, scalability, community support, and cost before selecting the most suitable software for their research endeavors.
Q1. What is the best data analysis software for research?
There is no single “best” data analysis software for research, as it depends on your specific needs and preferences. However, some popular options include R, Python (with libraries such as NumPy and pandas), SAS, SPSS, and MATLAB. These data analytics tools offer a wide range of functionalities and are commonly used by researchers for data analysis.
Q2. What factors should I consider when choosing data analysis software for research?
When selecting data analysis software, consider factors such as the complexity of your data, the statistical techniques you plan to use, your programming skills, the availability of specific features or modules, compatibility with other software or databases, user interface preferences, and the cost of the software.
Q3. Are there any free data analysis software options available for research?
Yes, there are several free and open-source data analysis tools option available. R and Python are popular choices in this category, offering extensive libraries and packages for data manipulation, visualization, and statistical analysis.
Additionally, tools like KNIME, Weka, and Orange provide user-friendly interfaces for data analysis and are free to use.
Q4. Can I use Microsoft Excel for data analysis in research?
While Microsoft Excel is widely used for data analysis, especially in non-academic settings, it may not be the most suitable option for advanced or complex research analyses. Excel has limitations in terms of data size, scalability, reproducibility, and statistical capabilities.
However, for simple analyses and basic calculations, Excel can be a useful data analytics tool.
Q5. Is it necessary to learn programming languages for data analysis software?
Learning programming languages like R or Python can significantly enhance your capabilities as a researcher in data analysis. These languages provide a wide range of libraries and packages specifically designed for statistical analysis, machine learning, and data visualization.
While programming skills are not always mandatory, they can enable more advanced and customizable analyses, automate repetitive tasks, and facilitate reproducible research.
There is more.
Check out our other articles on the Best Academic Tools Series for Research below.
- Learn how to get more done with these Academic Writing Tools
- Learn how to proofread your work with these Proofreading Tools
- Learn how to broaden your research landscape with these Academic Search Engines
- Learn how to manage multiple research projects with these Project Management Tools
- Learn how to run effective survey research with these Survey Tools for Research
- Learn how get more insights from important conversations and interviews with Transcription Tools
- Learn how to manage the ever-growing list of references with these Reference Management Software
- Learn how to double your productivity with literature reviews with these AI-Based Summary Generators
- Learn how to build and develop your audience with these Academic Social Network Sites
- Learn how to make sure your content is original and trustworthy with these Plagiarism Checkers
- Learn how to talk about your work effectively with these Science Communication Tools
Leave a Comment Cancel reply
Save my name, email, and website in this browser for the next time I comment.
We maintain and update science journals and scientific metrics. Scientific metrics data are aggregated from publicly available sources. Please note that we do NOT publish research papers on this platform. We do NOT accept any manuscript.
2012-2024 © scijournal.org

Master Your Research Projects with the Power of AI
ATLAS.ti bridges human expertise with AI efficiency to provide fast and accurate insights. Communicate directly with your documents and have them automatically coded based on your intentions, providing customized results. Only ATLAS.ti offers complete insight and verifiability of your AI analysis results at all times. This enables you to unpack the black box of AI in your research and uniquely make it your own.


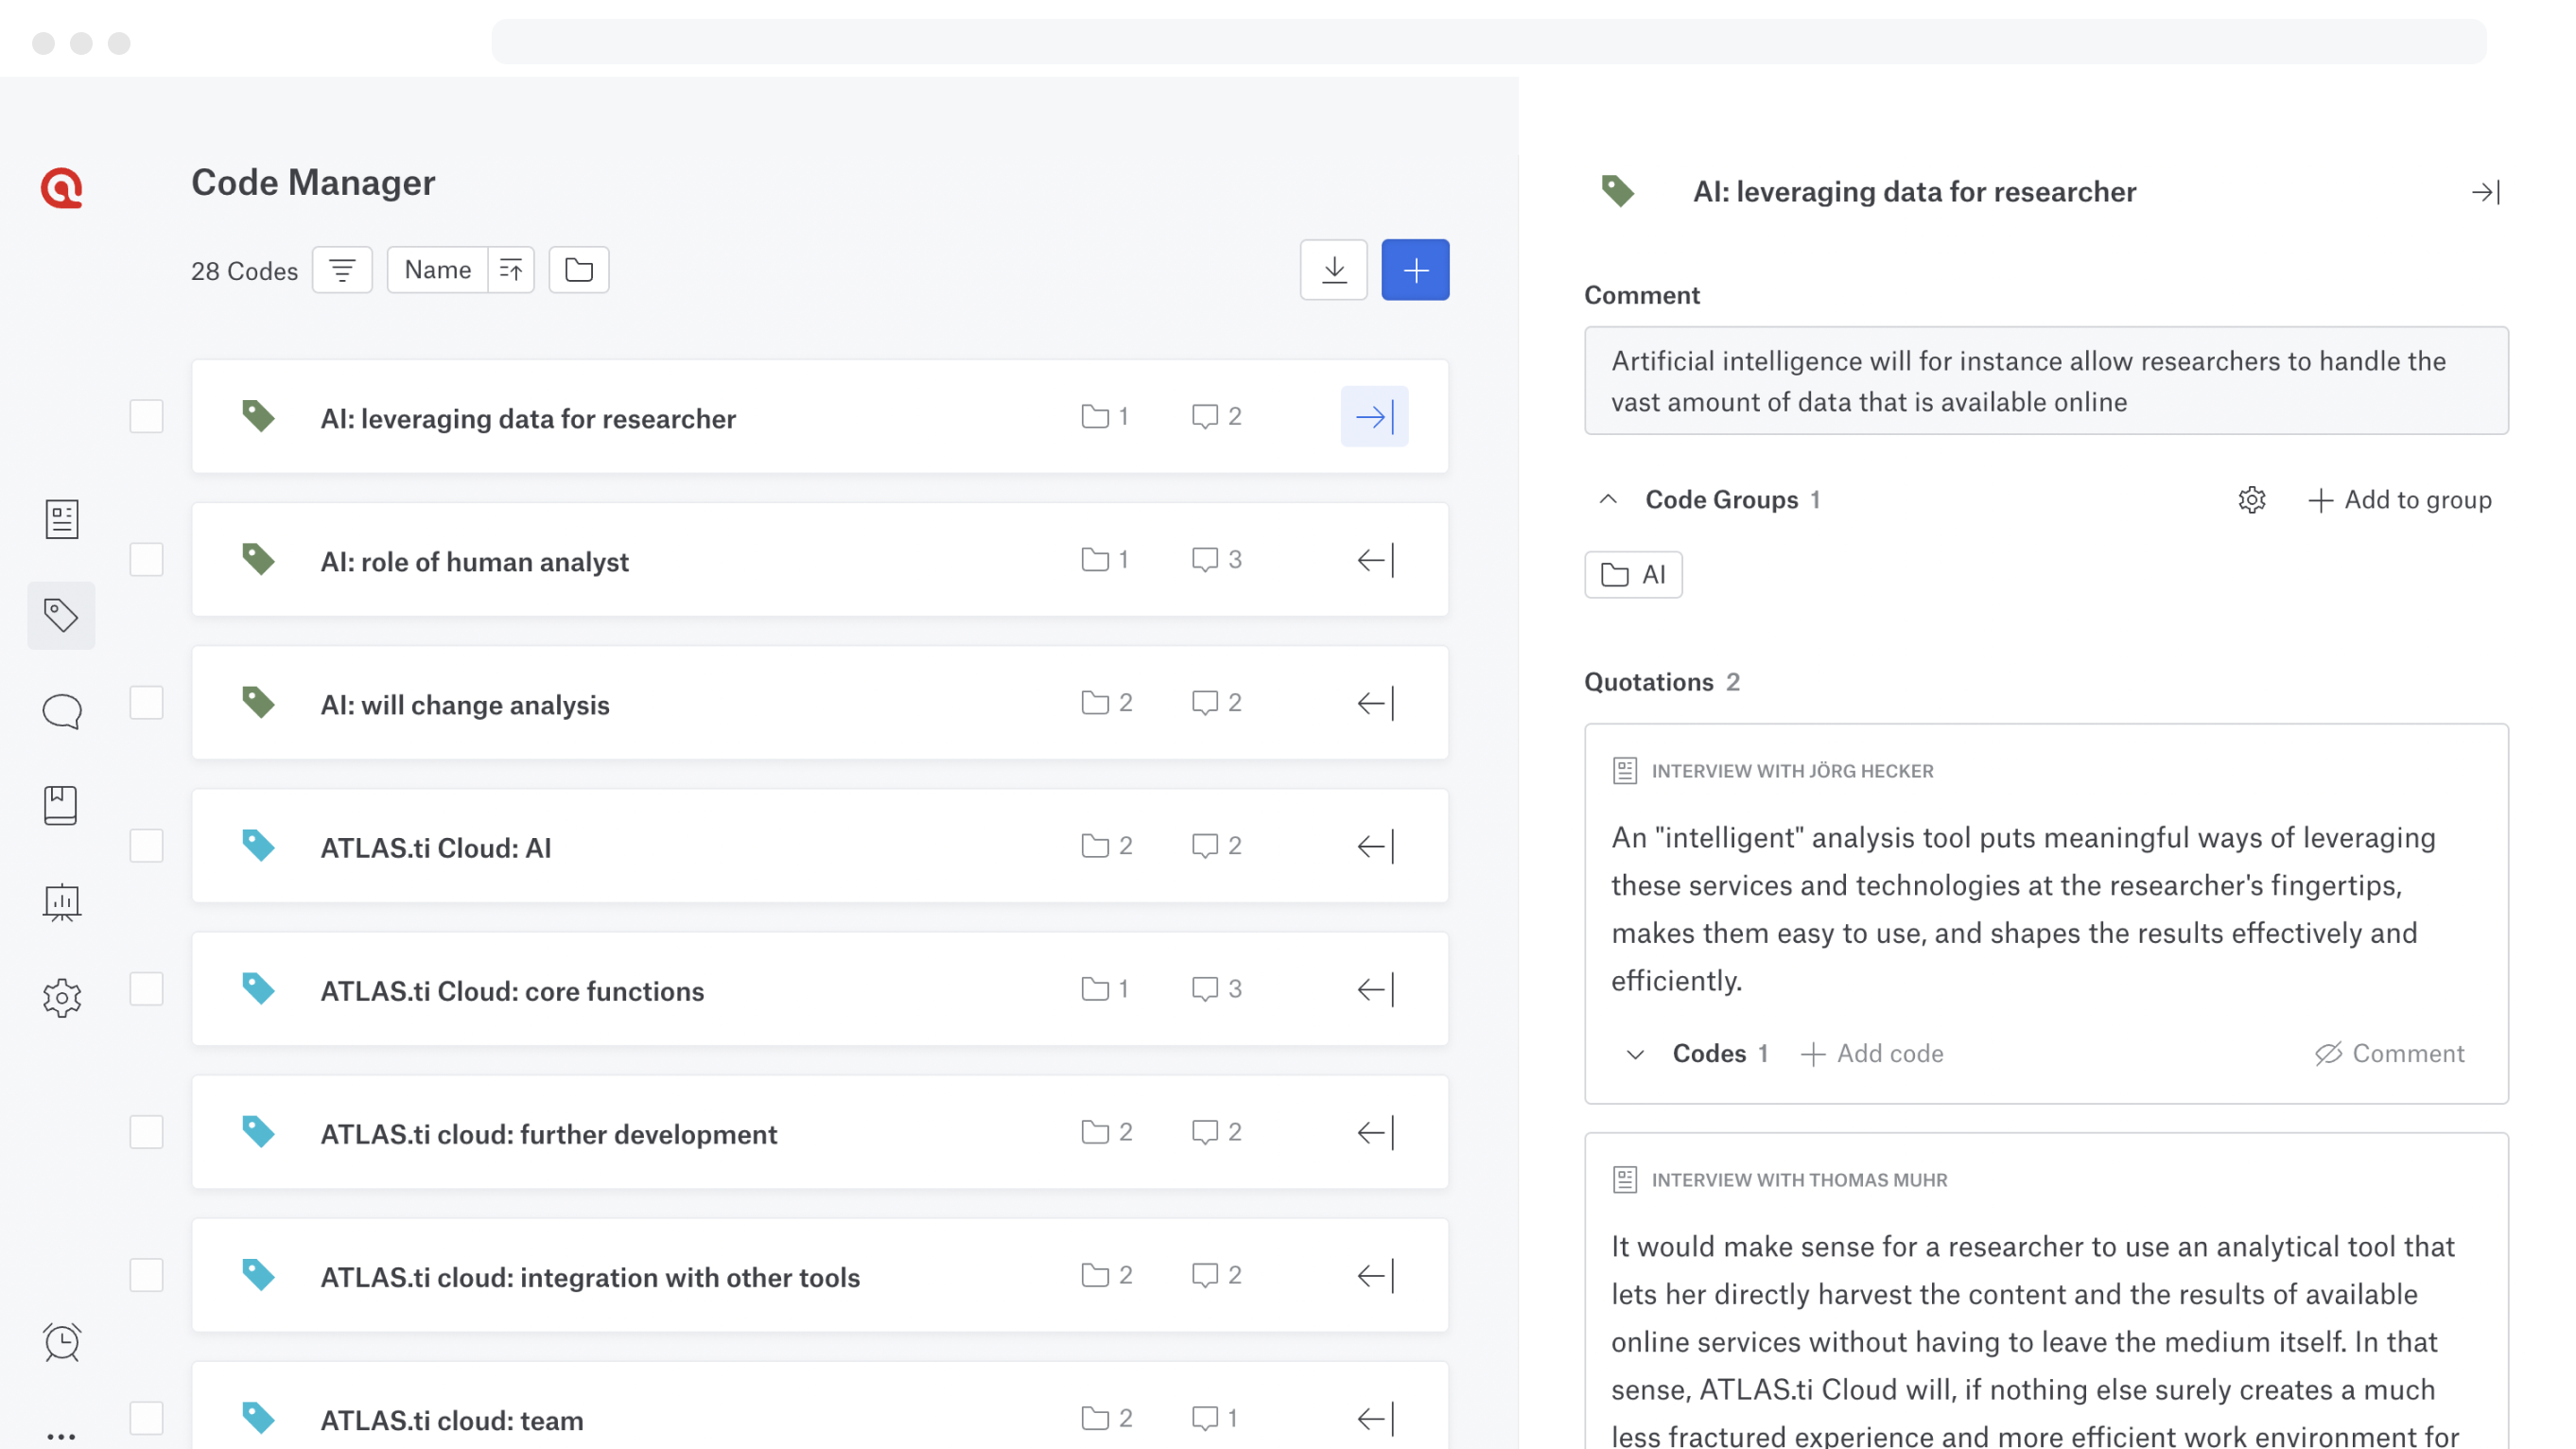
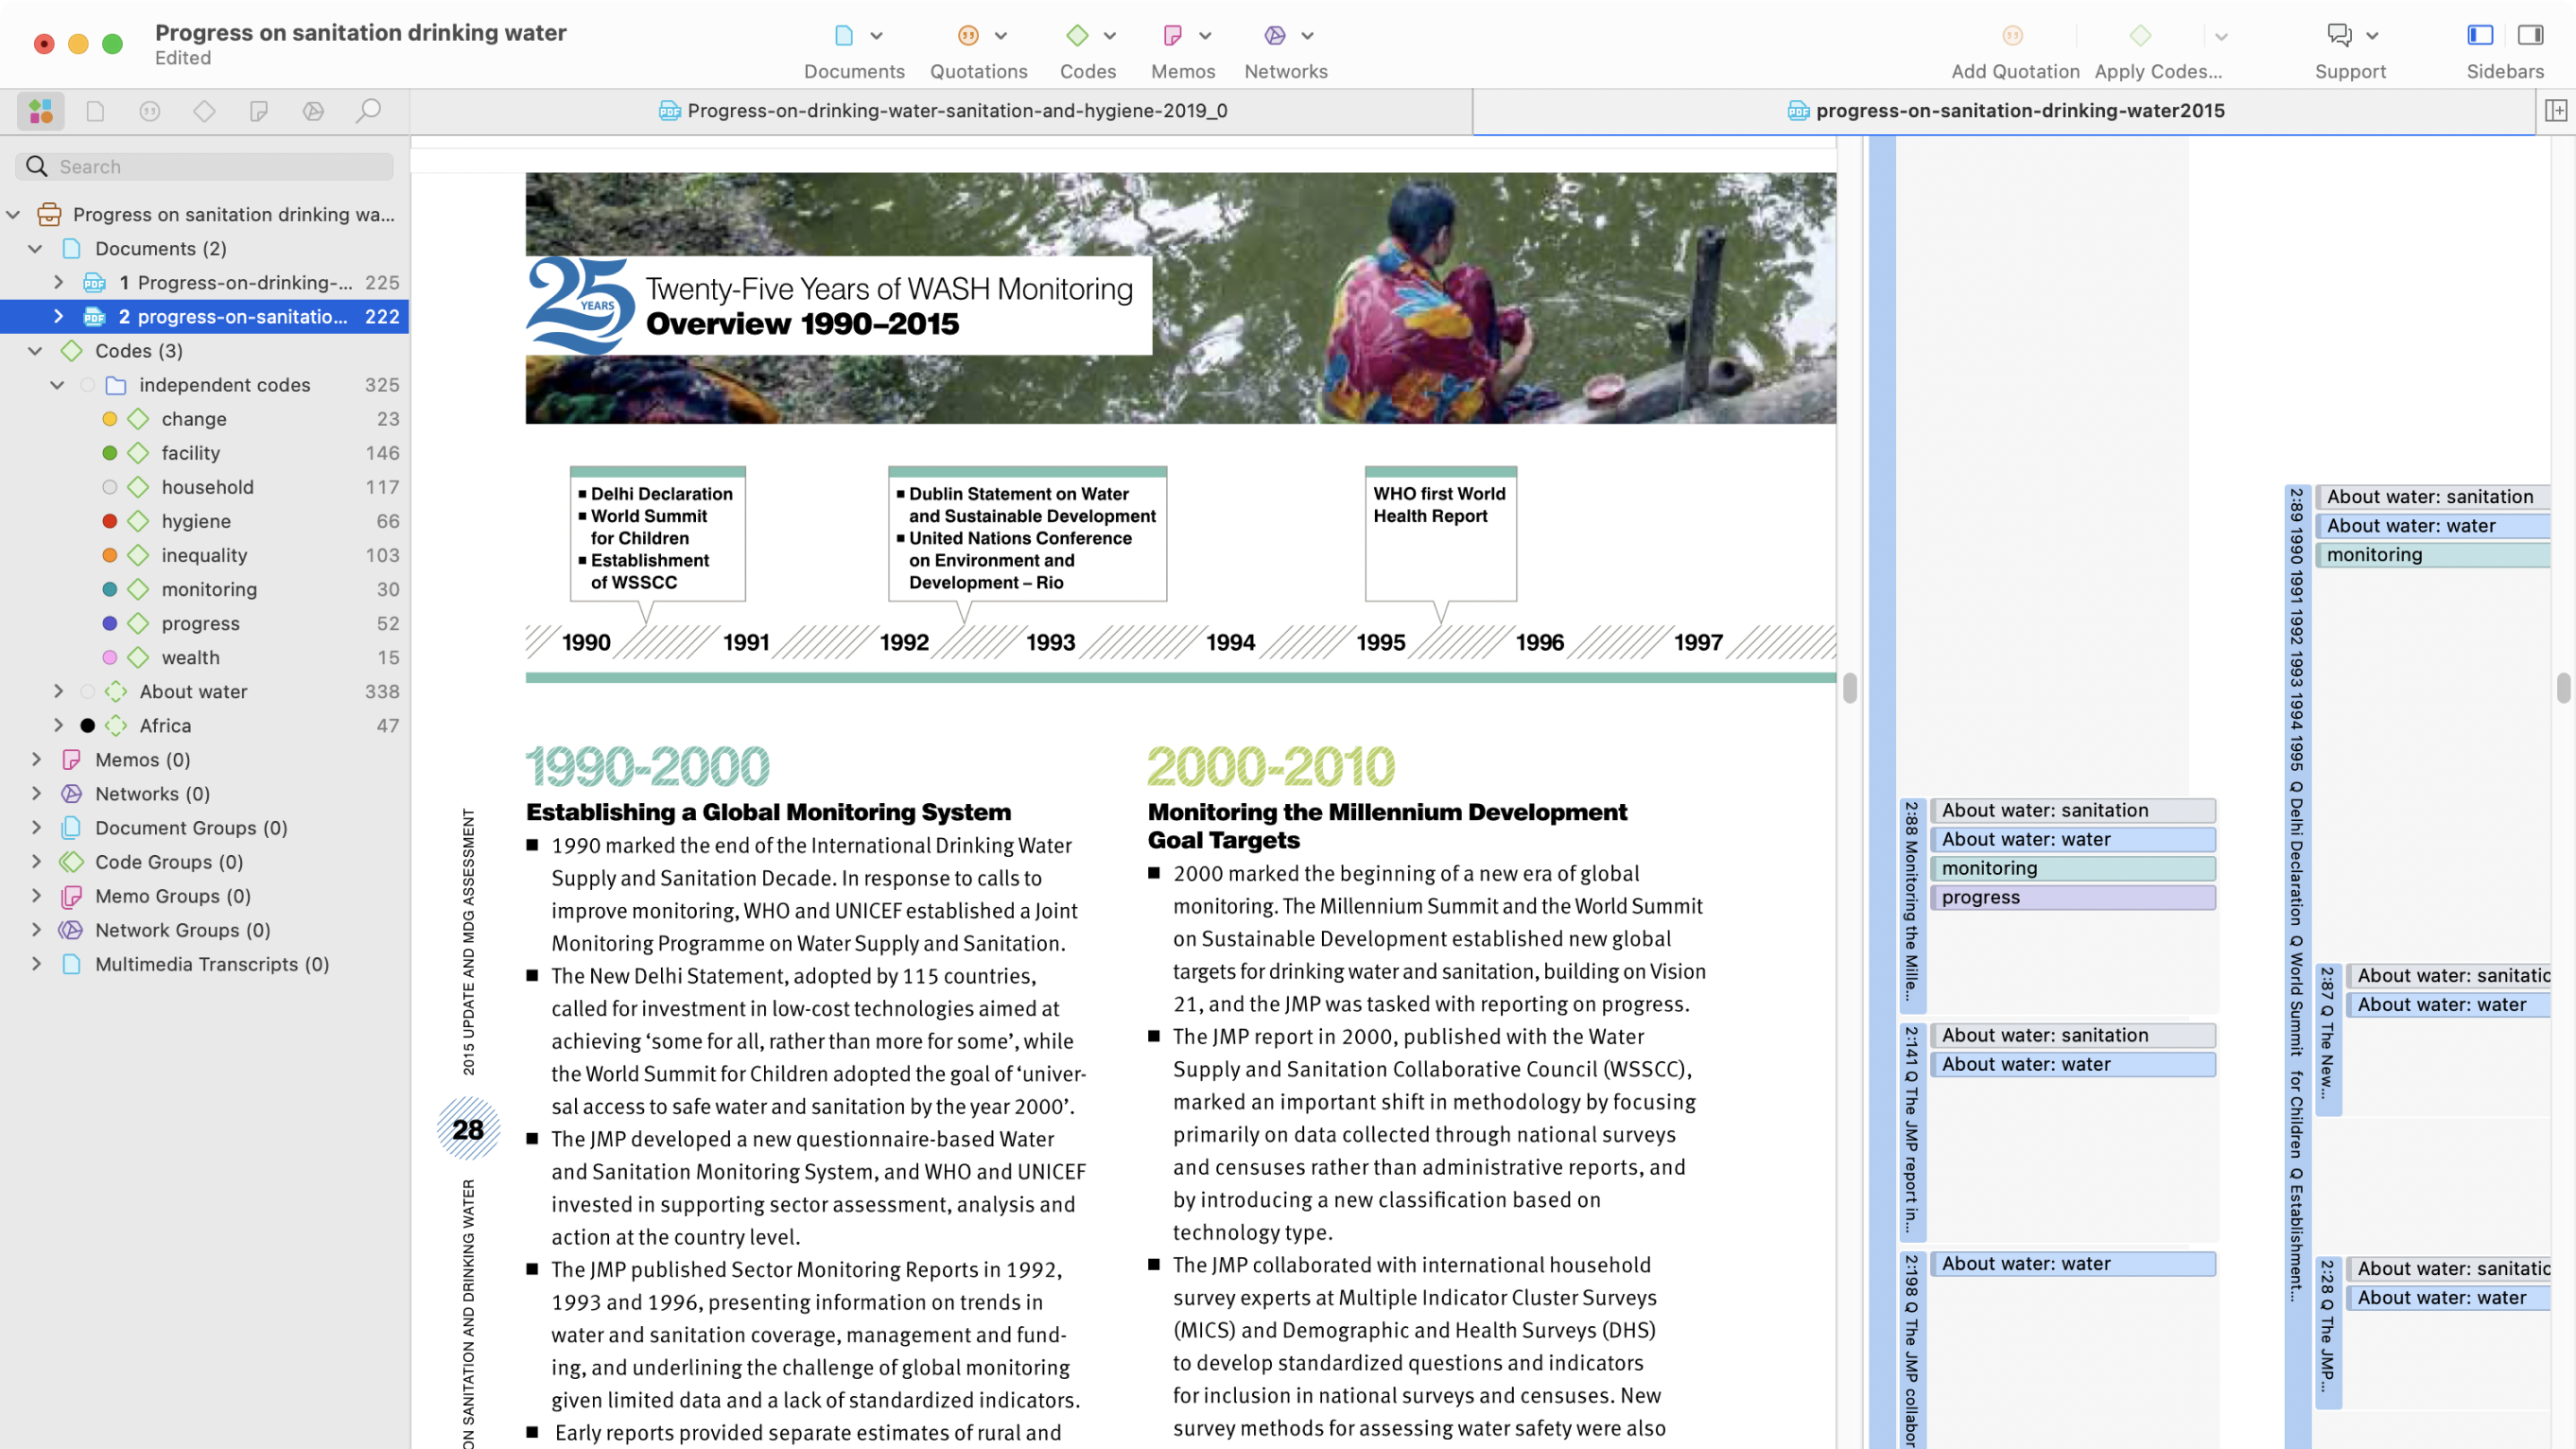

Import and organize your files
Import or upload data from any source and manage everything in one software package. Then, start discovering valuable insights using intelligent data analysis tools to make more informed decisions – in hours, not days. Easily import:
- Audio Files
- Social Media Data
- Survey Files
- Reference Manager Data
- Other Qualitative Data
Analyze and refine your data
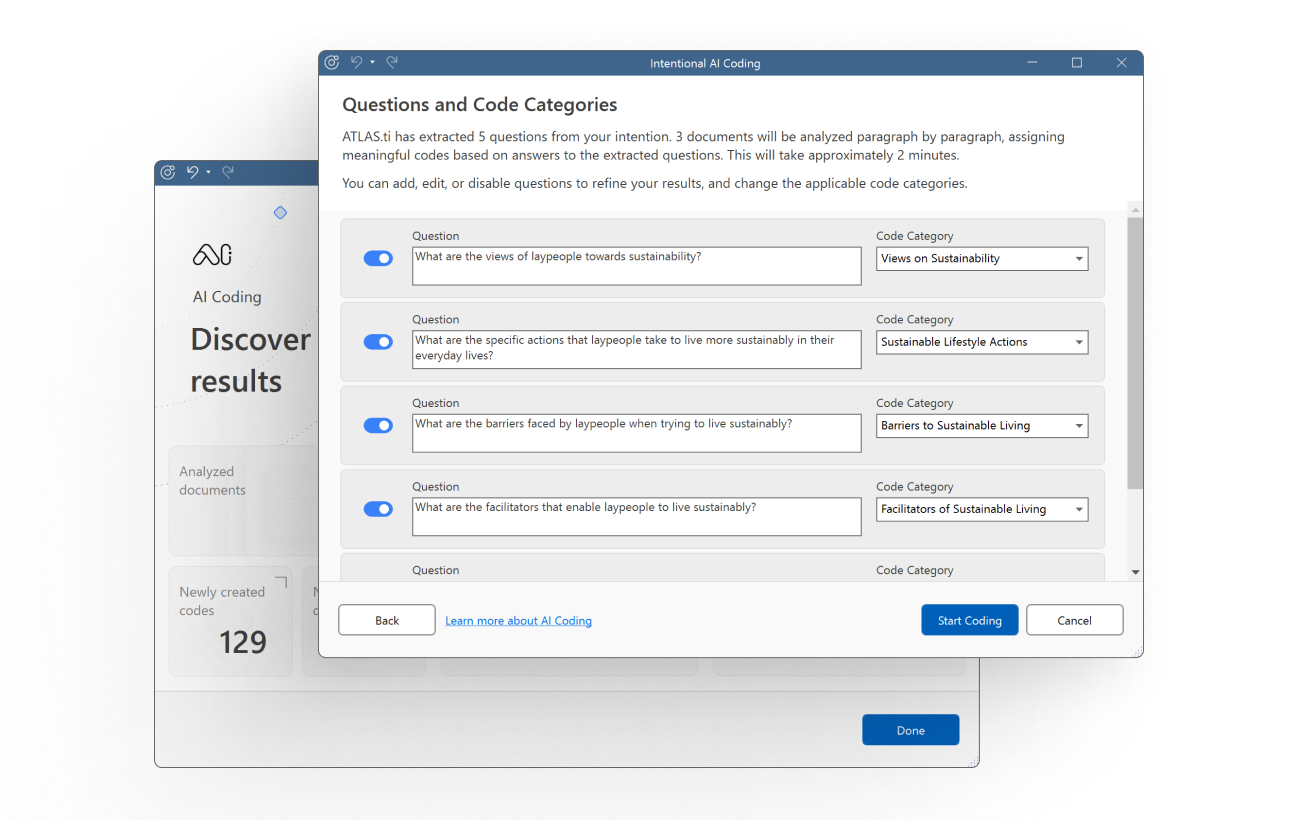
Anyone can take control of their qualitative analysis without prior knowledge: edit content, refine, and structure your data the way you need. Simply use codes to tag qualitative insights, and embrace AI Coding plus team collaboration for lightning-speed outcomes. Unlock insights for:
- Survey Data Analysis
- Interview Analysis
- Focus Group Analysis
- Literature Review and Analysis
- Content Analysis
- UX Research
- Bachelor & Master Thesis
- Doctoral Dissertations
- Term Papers
- Customer Feedback
- Qualitative Customer Data
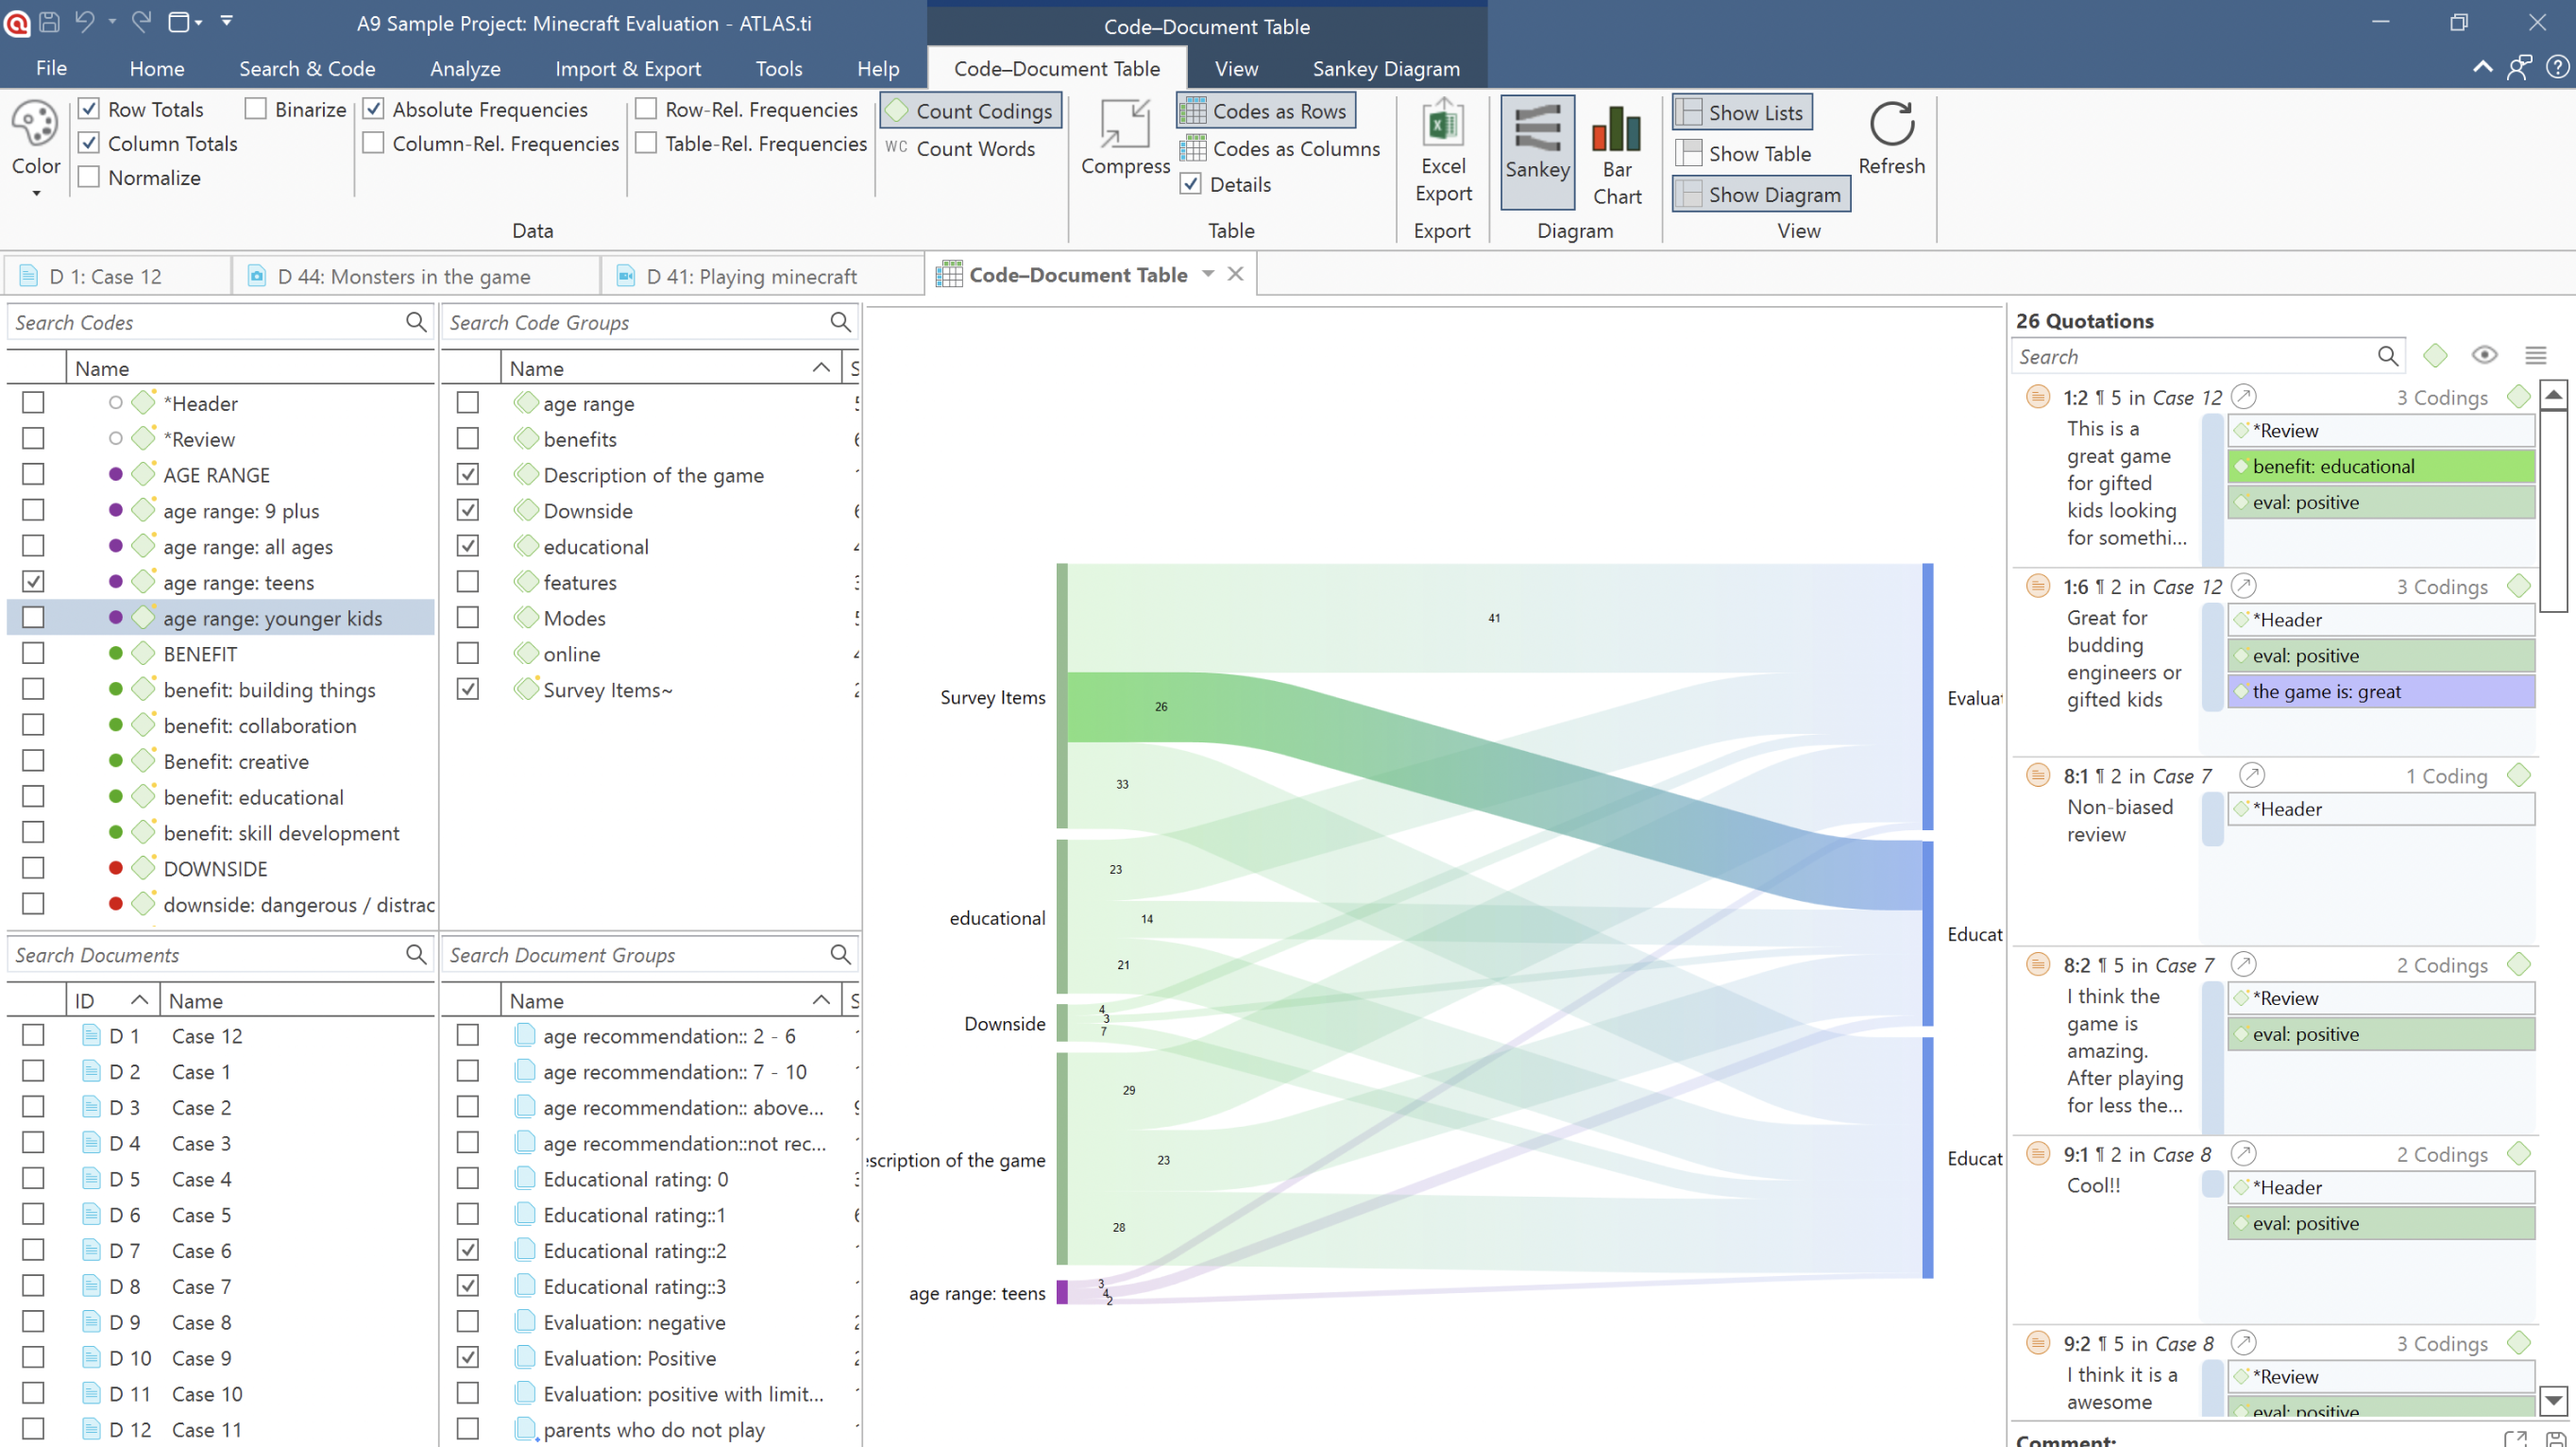
Visualize and share your insights
Let your data speak and get a deep understanding of the meaning behind your research findings. With ATLAS.ti, you can share your insights through clear visualizations that turn dull numbers into eye-opening results – presenting your conclusions with confidence. Make use of:
- Sankey Charts
- Donut Charts
- Word Clouds
Why our users love ATLAS.ti
Get all-in-one platform access to our desktop apps on Windows and Mac, plus our Web version for browsers. Leverage our cutting-edge QDA software today!
One Package, All Features
ATLAS.ti licenses offer access to all features on all platforms for one flat fee. No hidden costs, no surprises. Moreover, our multi-license options deliver exceptional flexibility for teams, simplifying the qualitative research process.
Free Live Support, 24/5
Our qualitative data experts and ATLAS.ti specialists work around the clock to provide the support you need. We will do everything to help you keep your analysis project running and uncompromised.
Full Compatibility: Win, Mac, Web
With ATLAS.ti, you can choose whether you want to work with our desktop apps on Windows and Mac or our Web version at no extra cost. Seamlessly exchange projects with each other – no matter which platform you use.
Team Collaboration in Real-Time
Working together with your entire team doesn’t have to be complicated. ATLAS.ti Web has simplified the process for you – easily invite team members and collaborate efficiently on your projects in real-time.
OpenAI-powered Tools
Reduce your overall data analysis time by more than 90% with the power of OpenAI and uncover insights that otherwise may have been missed. Enabled by leading AI technology, we provide a game-changing solution that makes automatic data coding a reality.
License Management Redefined
"My ATLAS.ti" enables you to manage users and licenses the way you want for the best efficiency: Share multi-user licenses with as many people as you want, with no restrictions on people, seats, or machines. When one user logs off, the seat instantly opens up for another user.

If you're considering ATLAS.ti for qualitative data analysis, you're making a wise choice. Our top-rated QDA software is perfect for students, researchers, academic institutions, and commercial enterprises – offering a wide array of AI-driven analysis tools to help you succeed. Here are just a few reasons to choose ATLAS.ti:
An intuitive interface made for qualitative research
ATLAS.ti caters to both research professionals and beginners. It covers everything from qualitative text analysis and evaluation of customer interviews to web content analysis and specific business intelligence tasks.
Users can collect and analyze data on the major operating systems (Windows and macOS), even with our Web version for browsers. Our user-friendly qualitative data analysis software makes it easy to upload files and analyze data quickly and efficiently so that you can make the most out of your research.
Quick and easy AI-powered coding
Transforming text-based data into valuable insights can be time-consuming. With ATLAS.ti, you can import data from any source and gain deeper insights using AI. In addition, our qualitative data analysis software offers tools to automatically create coded segments in your data and quickly identify themes.
ATLAS.ti's qualitative data analysis tools enable you to organize all your text data (i.e., from customer interviews or focus groups) in one place. This way, you can analyze qualitative data faster than ever. Plus, you can utilize a code hierarchy with a tree structure for better code management.
Our automatic AI Coding feature uses OpenAI's GPT model, which can understand natural language on a human-like level. More than text mining: This groundbreaking analysis tool empowers users from all fields of work by drastically reducing the overall coding and analysis time.
Cover all your qualitative data analysis needs
Whether you rely on transcripts from focus groups , observation notes, survey responses , or even audio and video files – you can analyze it all with ATLAS.ti. Unlike quantitative data tools, our software supports all major forms of data so that you can conduct qualitative data analysis on any research project, even customer feedback, textual data, pictures, and video recordings.
Whatever it is, you can import data into one central location in ATLAS.ti – enabling you to leverage qualitative and mixed methods for your research projects.
Powerful data analysis on autopilot
Our artificial intelligence and machine learning tools make finding insights in your research project easy. Qualitative data analysis tools such as Sentiment Analysis and Opinion Mining can perform text analysis across multiple documents to analyze large projects faster and more insightful.
Whether you want to analyze customer data or identify keywords from research materials, our AI tools can help you finish the job quickly. Regardless of what you want to achieve: pure qualitative data analysis or mixed methods research , ATLAS.ti offers the leading solution trusted by academics and businesses.
Deeper insights through qualitative analysis
We understand that any qualitative data analysis tool is only as powerful as the insights they provide to you and your audience. ATLAS.ti is more than a text analyzer – we develop our QDA software to visualize your data analysis in multiple formats:
Bar charts, Sankey diagrams, word clouds, and network visualizations help you identify data themes and patterns for robust and accurate insights.
Seamless collaboration across teams
Qualitative research and mixed methods research often relies on collaboration between team members. That's why multi-user licenses for ATLAS.ti allow you to share our qualitative data analysis software with your colleagues.
Now all your team members can work together on the same project to analyze qualitative data . Unlike other QDA software, ATLAS.ti allows you to capture customer insights with the collective power of your colleagues.
Expert support and training
Customer satisfaction is our top priority at ATLAS.ti. We offer technical and methodological support for all users, whether conducting mixed methods research, qualitative research , statistical analysis, thematic analysis , market research, or academic research.
ATLAS.ti experts worldwide are always just a click away from supporting the users of our #1 software for qualitative data analysis.
- Skip to main content
- Skip to primary sidebar
- Skip to footer
- QuestionPro

- Solutions Industries Gaming Automotive Sports and events Education Government Travel & Hospitality Financial Services Healthcare Cannabis Technology Use Case AskWhy Communities Audience Contactless surveys Mobile LivePolls Member Experience GDPR Positive People Science 360 Feedback Surveys
- Resources Blog eBooks Survey Templates Case Studies Training Help center
Home Market Research
10 Best Qualitative Data Analysis Software of 2024
Choosing the right qualitative data analysis software can be a bit challenging, especially with so many choices available. Whether you’re a researcher, business leader, or marketer, analyzing qualitative data is essential for understanding your audience and making informed decisions.
From customer feedback to market research, qualitative insights help you understand people’s thoughts, feelings, and behaviors. However, without the right tools, analyzing all that data can be challenging.
In this blog, we’ll explore the 10 best software options available today. We’ll highlight their key features and benefits to help you find the one that best suits your needs. Let’s see how the right software can help you gain valuable insights and make smarter decisions!
What is qualitative data analysis software?
Qualitative data analysis software helps researchers, analysts, and professionals manage, organize, and analyze non-numerical or qualitative data. Qualitative data refers to:
- Descriptive and text-based information
- Text documents
- Audio recordings
Unlike quantitative data analysis software that focuses on numerical data, qualitative data analysis tools handle and interpret the complexities of qualitative data. These tools provide a range of features and functionalities to help users make sense of their qualitative data. These software solutions often include:
- Text Coding and Categorization
- Data Organization
- Search and Retrieval Capabilities
- Memo and Annotation Features
- Analytics Tools
- Mixed Methods Research
- Multi-Language Support
- Qualitative Comparative Analysis Tools
- Sentiment and Text Analysis Tools
- Data Visualization
- Collaboration tools, and more.
By using qualitative data analysis software, researchers can uncover patterns, themes, and insights within large volumes of qualitative data, facilitating more informed decision-making and in-depth exploration of qualitative research topics.
Learn more about Qualitative Data, Types, Analysis, and Examples
Why should you use qualitative data analysis software?
Using qualitative data analysis (QDA) software is important for researchers and professionals who want to analyze and gain insights from qualitative data efficiently. Here are five reasons to consider using these tools:
1. To simplify data analysis
Qualitative data analysis tools make analyzing large amounts of text much easier. They help you organize and process data quickly, saving time and effort.
2. To uncover deeper insights
These tools allow you to find hidden patterns, emotions, and themes in your data, which can help you better understand your qualitative research project or business issue.
3. To use both qualitative and quantitative data
Many of these tools support qualitative and mixed methods research, meaning you can combine both qualitative and quantitative data . This gives you a broader perspective and more well-rounded results.
4. To perform statistical analysis
Some tools include features for statistical analysis, which lets you apply numbers to your qualitative research. This can help verify your findings and add credibility to your conclusions.
5. To collaborate and report more easily
These tools make it easier to work with others, share insights, and generate detailed reports, helping you present your results clearly and professionally.
Using these tools can help you analyze your data more deeply, make smarter decisions, and communicate your findings effectively.
Best 10 qualitative data analysis software
Qualitative data analysis software is great for businesses wanting to understand their customers better. It gives detailed insights into what customers think, prefer, and how they behave. Let’s explore the top 10 software options for qualitative data analysis .

01. QuestionPro: The best qualitative data analysis software
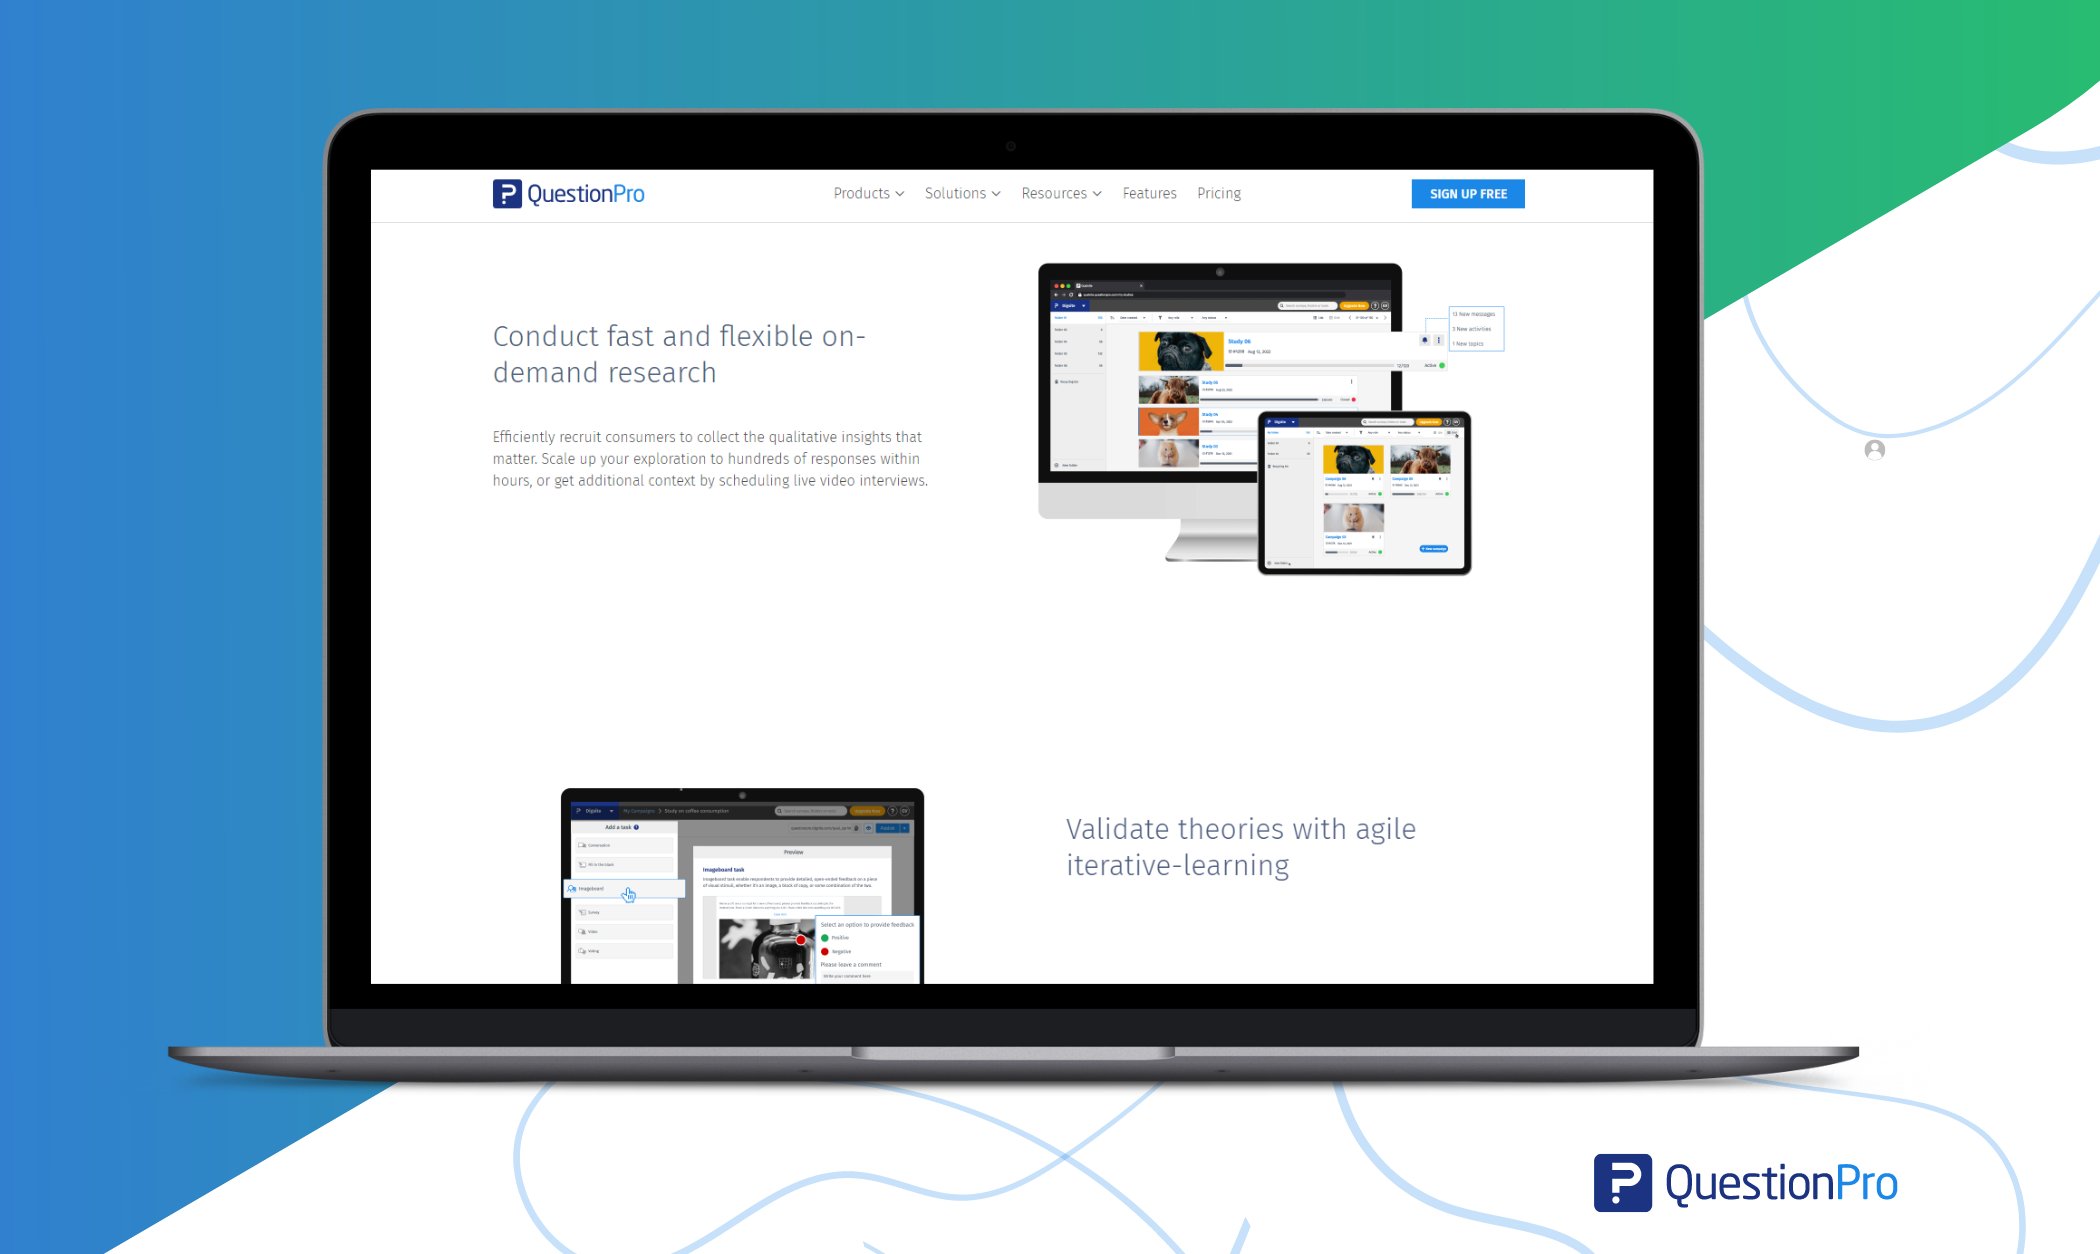
QuestionPro is great for analyzing customer feedback. This software is easy to use and helps businesses better understand their customers by gathering data through surveys, reviews, and more.
With its features and focus on qualitative analysis, QuestionPro helps you make data-driven decisions by converting customer feedback into insights.
The software is designed to be nontechnical, so data collection and analysis are easy. Whether you are a small business or a large enterprise, QuestionPro scales to your needs, so it’s a good option for all sizes of organizations.
Its features for analyzing qualitative data also make it a great choice for businesses wanting detailed customer insights .
- Data visualization and analysis
- Text analysis
- Sentiment analysis
- Word cloud generation
- Feedback analysis
- Integration with 3rd party tools
- QuestionPro is great for creating customizable surveys and questionnaires .
- Real-time sentiment analysis to get customer sentiments.
- The automated sentiment analysis categorizes responses as positive, negative, or neutral.
- Free license never expires. Upgrade anytime.
- Pricing for premium features and packages starts from $99/month.
MAXQDA is a versatile tool designed to handle all types of data, like interviews, surveys, videos, and social media content.
- Import text, audio, and video files
- Advanced coding and tagging
- Mixed methods analysis support
- Visual exploration of data
- Easily handle different data formats.
- Combine qualitative and quantitative data.
- Supports various coding methods.
- Free version is limited; full features require a license.
- Premium plan starts from $45/month.
03. Quirkos
Quirkos focuses on comparing data side by side, helping users identify trends and customer behavior .
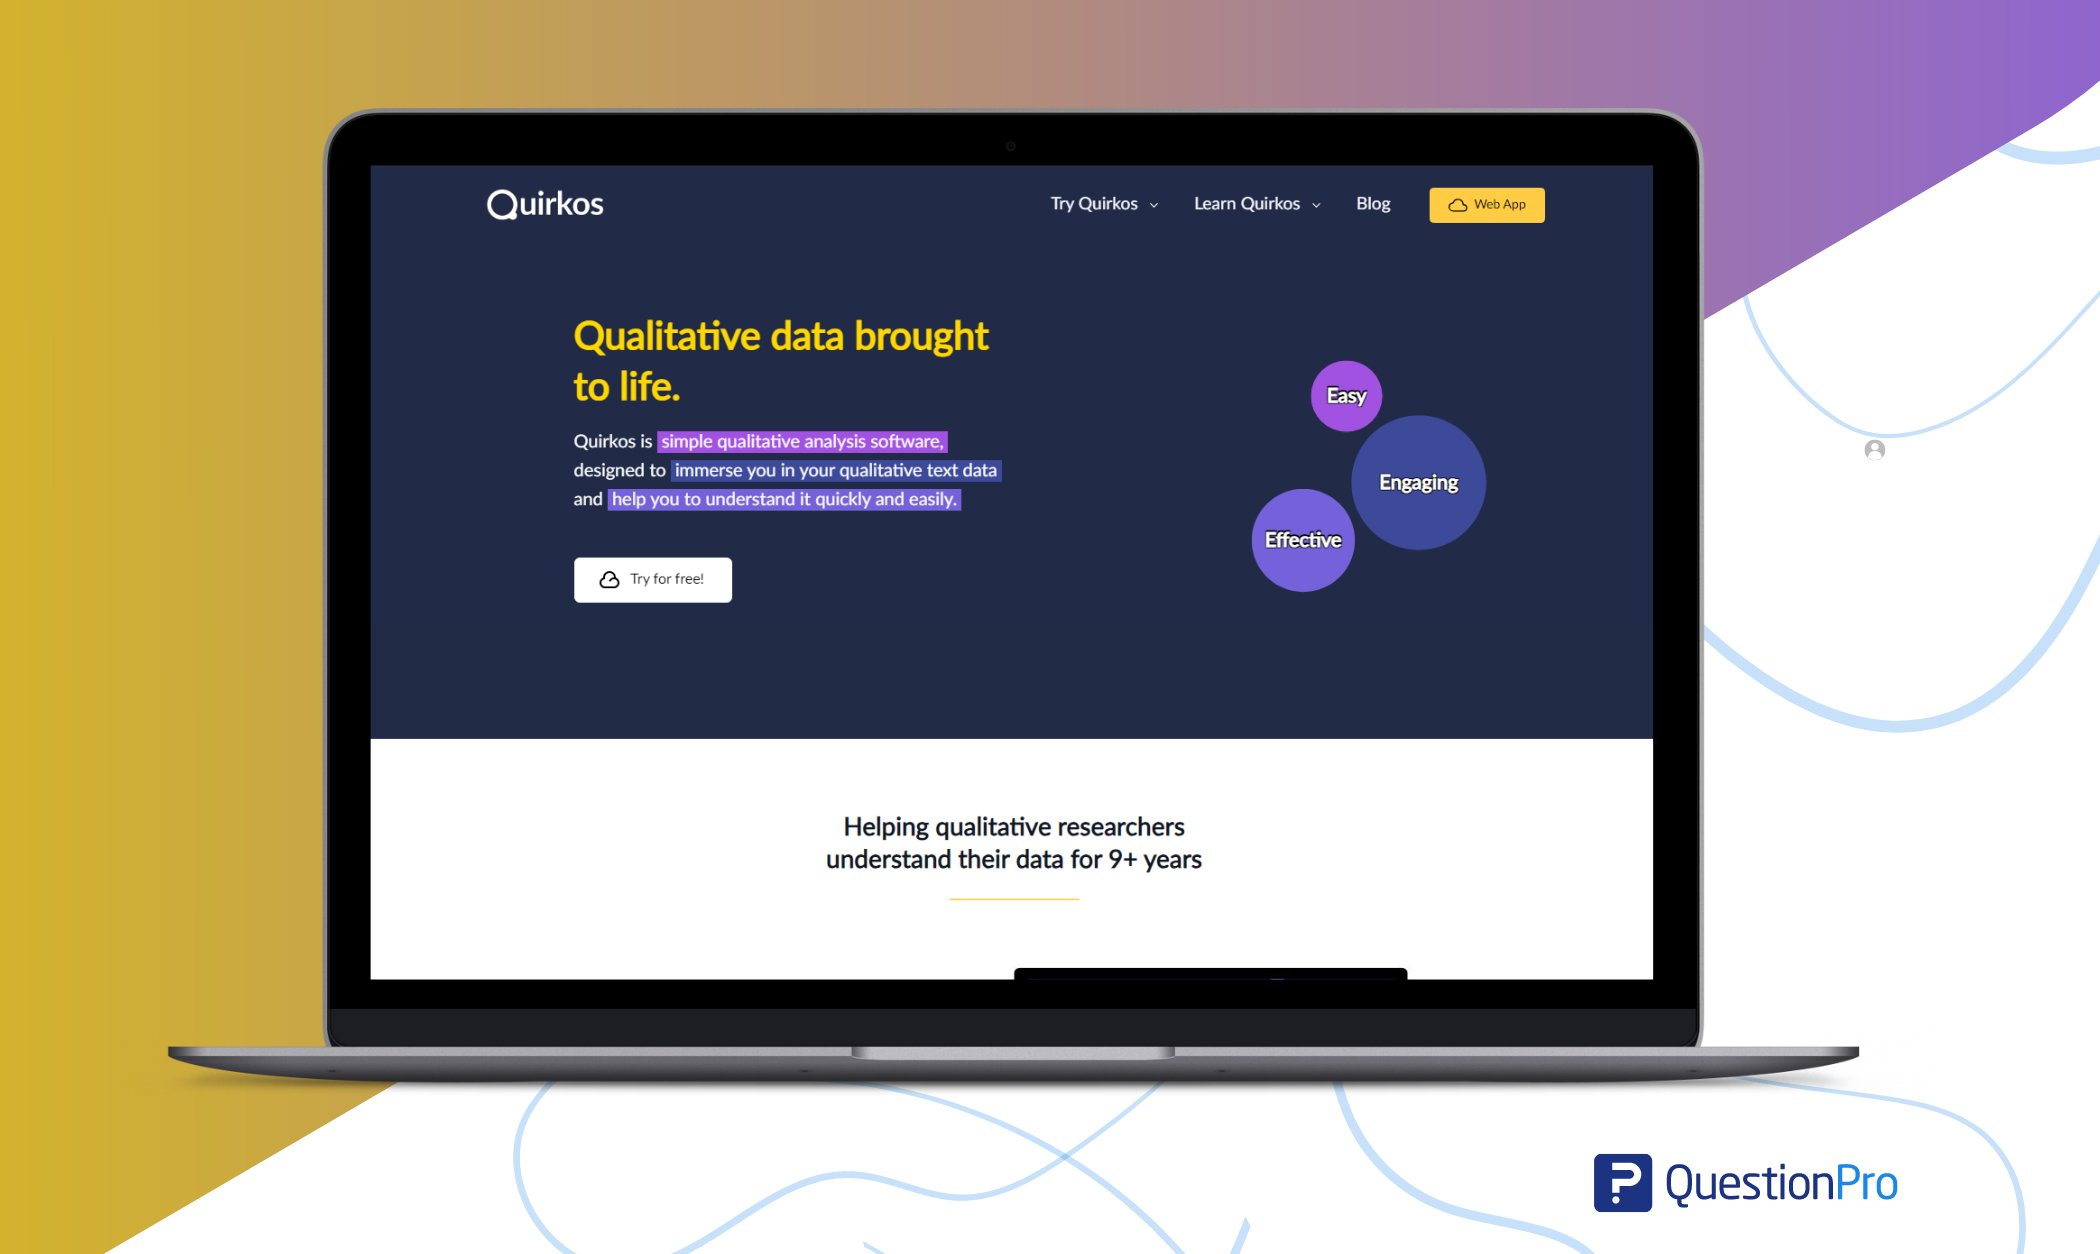
- Comparative analysis
- Drag-and-drop coding
- Real-time data visualization
- Theme color customization
- Integration with SPSS, Word, Excel
- Works on different operating systems.
- Easy drag-and-drop and color-coding features improve user experience.
- Color-coded themes enable quick identification and data segmentation analysis .
- Lacks some advanced features found in other tools.
- Does not have advanced AI-driven features for automated sentiment analysis or survey data insights.
- Premium plan starts from $5/month.
04. Raven’s Eye
Raven’s Eye is ideal for analyzing natural language data. Its standout feature is the ability to convert audio to textual data, making it perfect for studying customer interviews .
- Natural language audio and text analysis
- Real-time data processing
- Audio transcription
- Converts audio to text for easy analysis, particularly useful for interview data.
- Supports multiple languages.
- Helps analyze both text and spoken words.
- Accuracy depends on audio quality.
- Premium plan starts from $35/month.
05. Square Feedback
Square Feedback is a free tool for collecting customer feedback, with added features for qualitative analysis.
- Integrates with digital receipts
- Historical data comparison
- Simplifies customer feedback collection.
- Tracks and analyzes comments.
- Visualizes insights in charts and graphs.
- Limited advanced analysis features.
- Available upon request.
LiGRE caters to students, researchers, and professionals. It’s great for analyzing interviews and large text datasets.
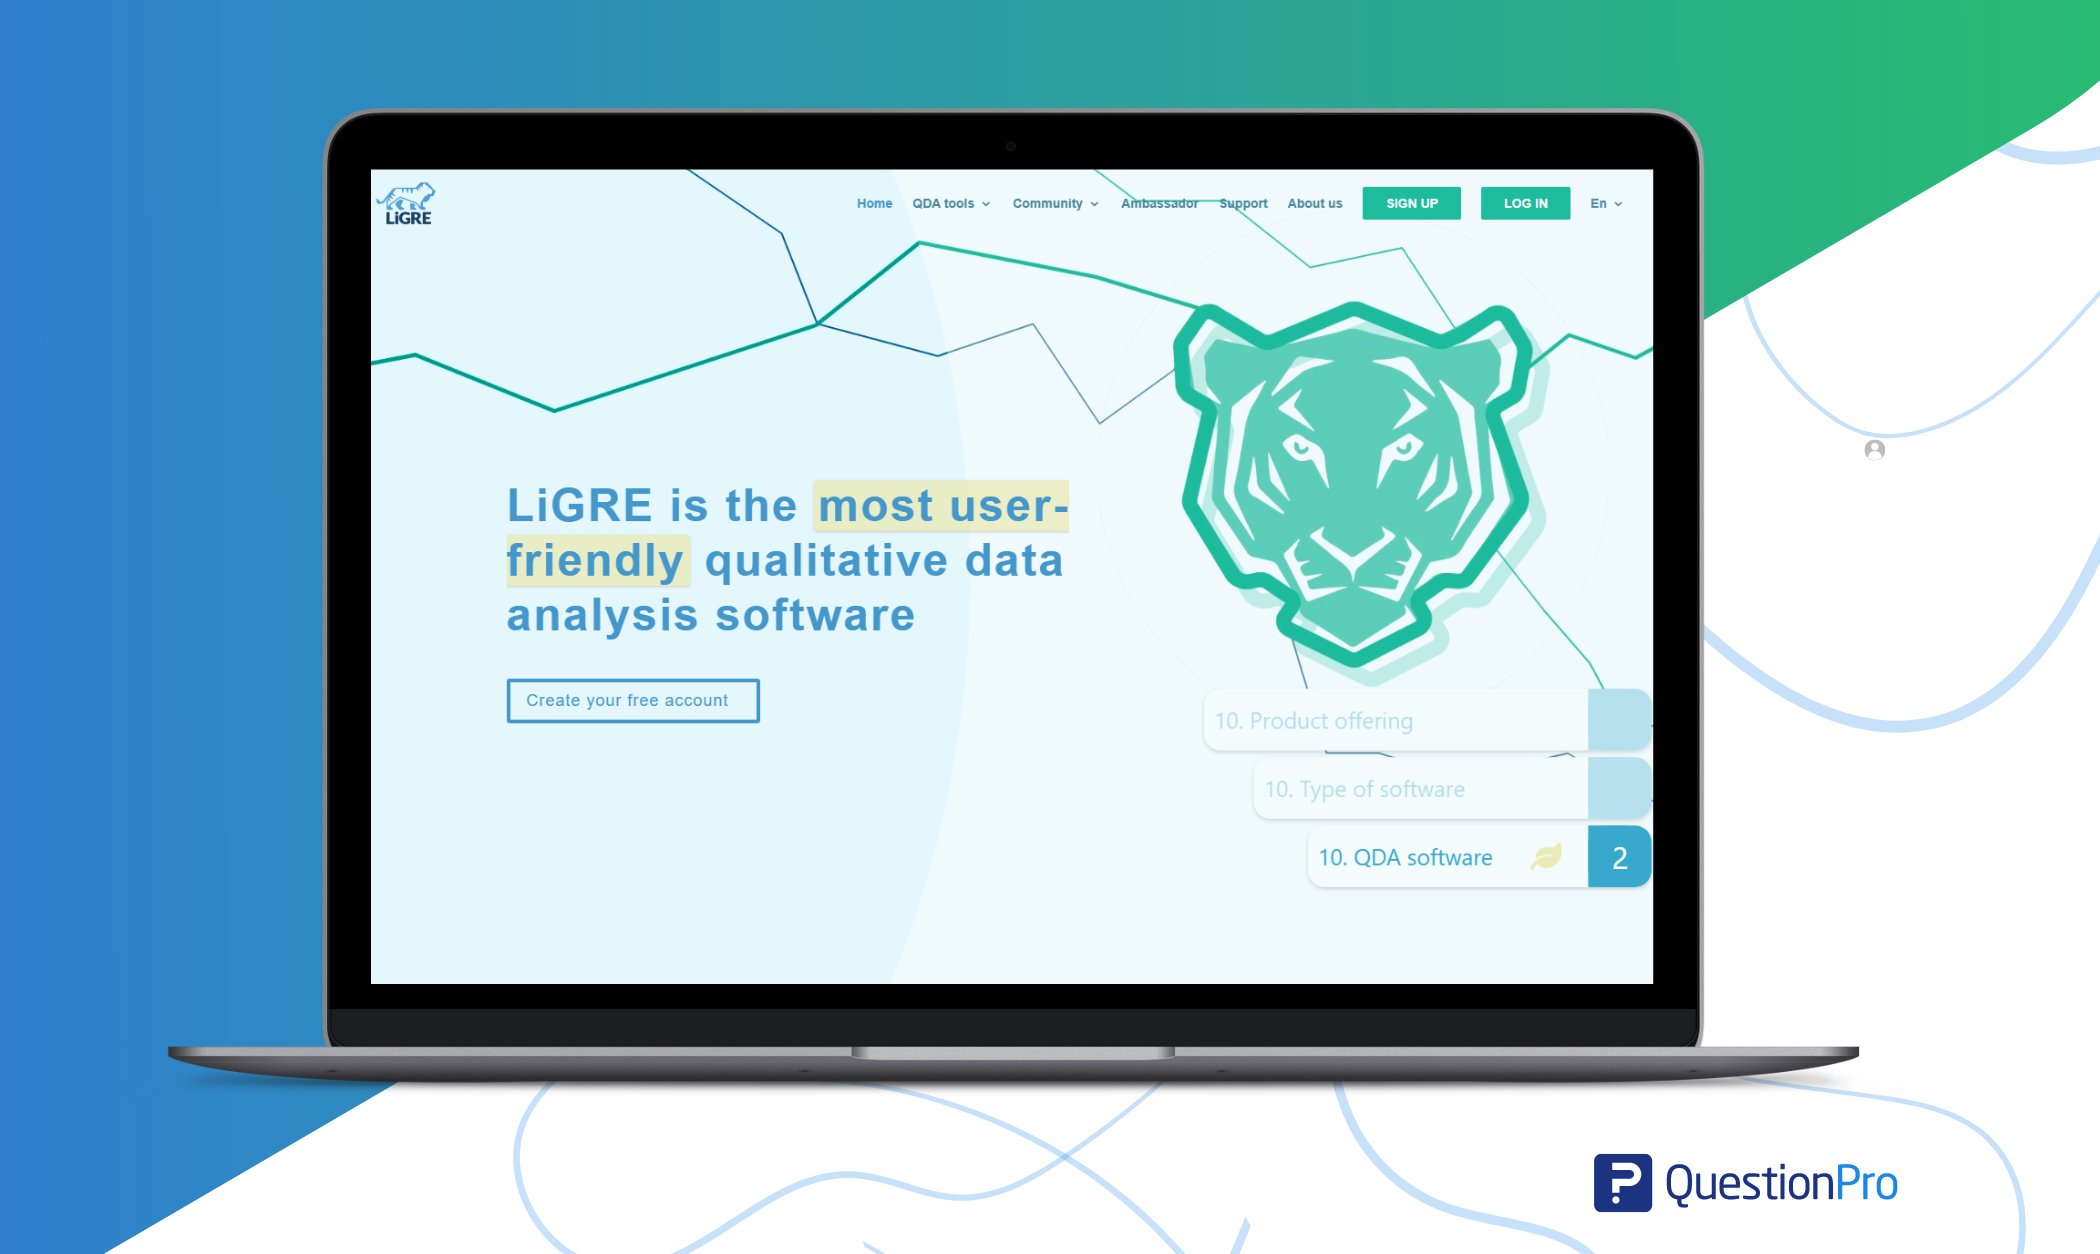
- Automatic transcription of audio and video
- Survey building and data merging
- Multimedia data support
- Collaboration via LiGRE laboratory
- Saves time by transcribing audio and video.
- Easy survey creation for data collection.
- A collaborative platform for teams to work together on a qualitative research project.
- Requires some time to learn and adapt features and functionalities.
- Limitations with extensive data sources management.
- Requires compatible hardware and software for efficient usage.
07. QDA Miner Lite
QDA Miner Lite is simple to use for analyzing interviews, open-ended responses, and other qualitative data. This tool is particularly advantageous for researchers seeking to uncover intricate patterns and insights within qualitative data.
- Easy data coding and retrieval
- Visual presentation of results
- Mixed methods analysis
- Supports various data formats.
- Helps retrieve specific text for analysis.
- New users may require time to master.
08. Dedoose
Dedoose is a comprehensive software for qualitative and mixed-method research. It can analyze text, audio, images, videos, and surveys.
- Mixed-method analysis
- Interactive data visualization
- Advanced analytics tools
- Combines qualitative and quantitative research .
- Visually engaging presentations.
- Supports coding and analysis of various types of media and data.
- New users may need time to adjust.
- Limitations on data export formats or options.
- Premium plan starts from $13/month.
09. Glimpse
Glimpse is a great option for customer success teams. It provides insights into customer behavior through sentiment analysis.
- Cross-platform data collection
- Real-time data collection and analysis
- Understands customer emotions and sentiments.
- Collects data from multiple platforms.
- Usages machine learning methods to analyze qualitative data.
- Machine learning features can be complex.
- Premium plan starts from $458/month.
10. HubSpot
HubSpot’s customer feedback tool offers qualitative data collection and analysis, especially from surveys and reviews.
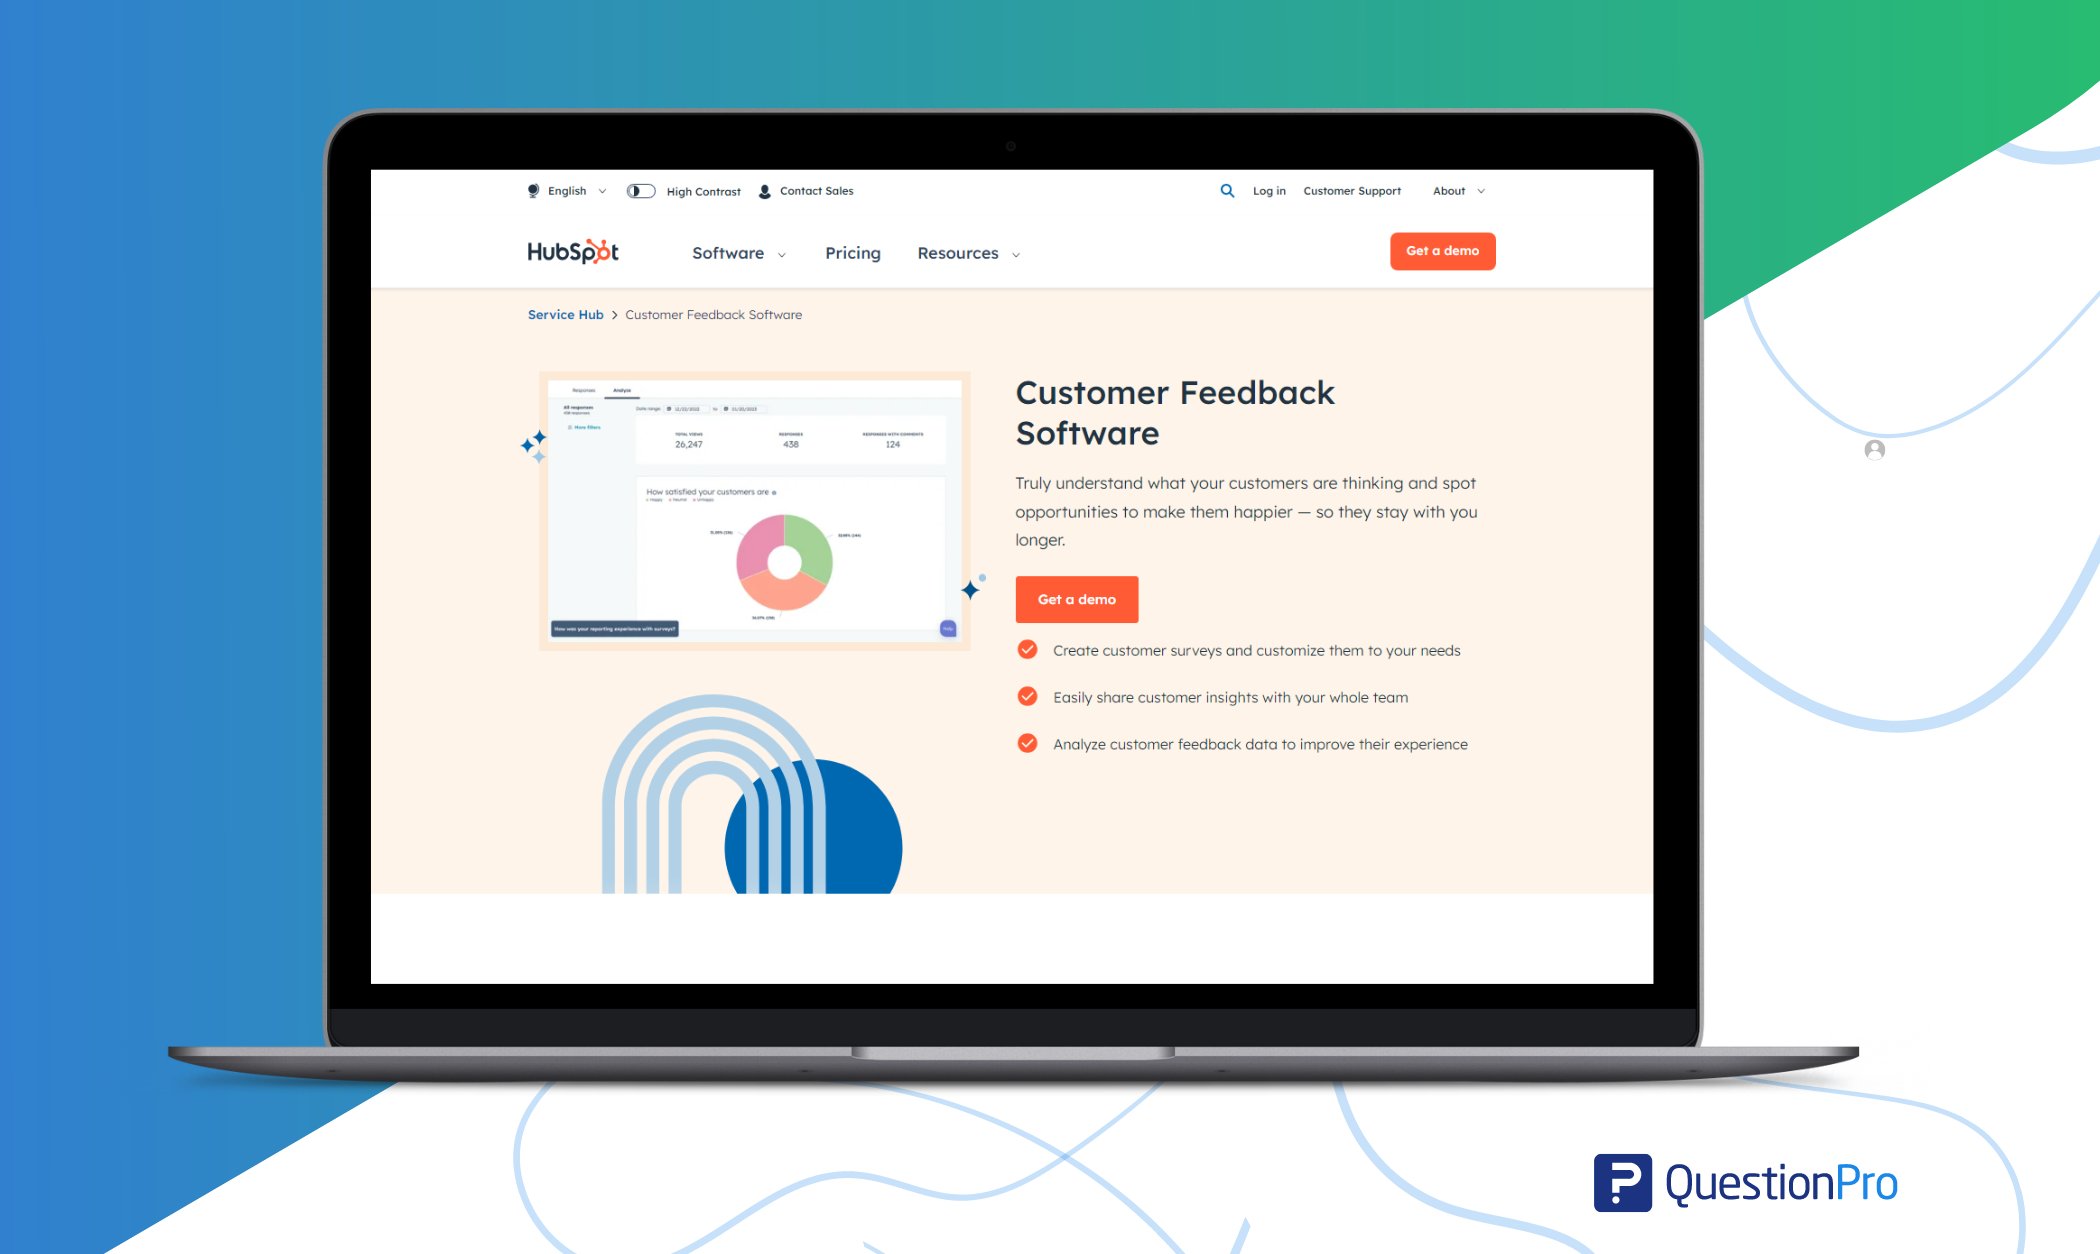
- Customer feedback analysis
- NPS surveys integration
- Integrates NPS surveys to simplify customer feedback collection.
- Provides visual representations of customer insights for better understanding.
- Collects and analyzes both quantitative and qualitative customer feedback .
- Lacks advanced analysis features compared to specialized tools.
- Premium plan starts from $15/month.
Whether you’re a business owner, a student, or simply intrigued about the beauty of language, explore these text analysis tools and make your life easier.
Why is QuestionPro the best qualitative data analysis software?
When it comes to analyzing qualitative data, especially from surveys or mixed-method research, QuestionPro stands as one of the top tools available. Here’s why:
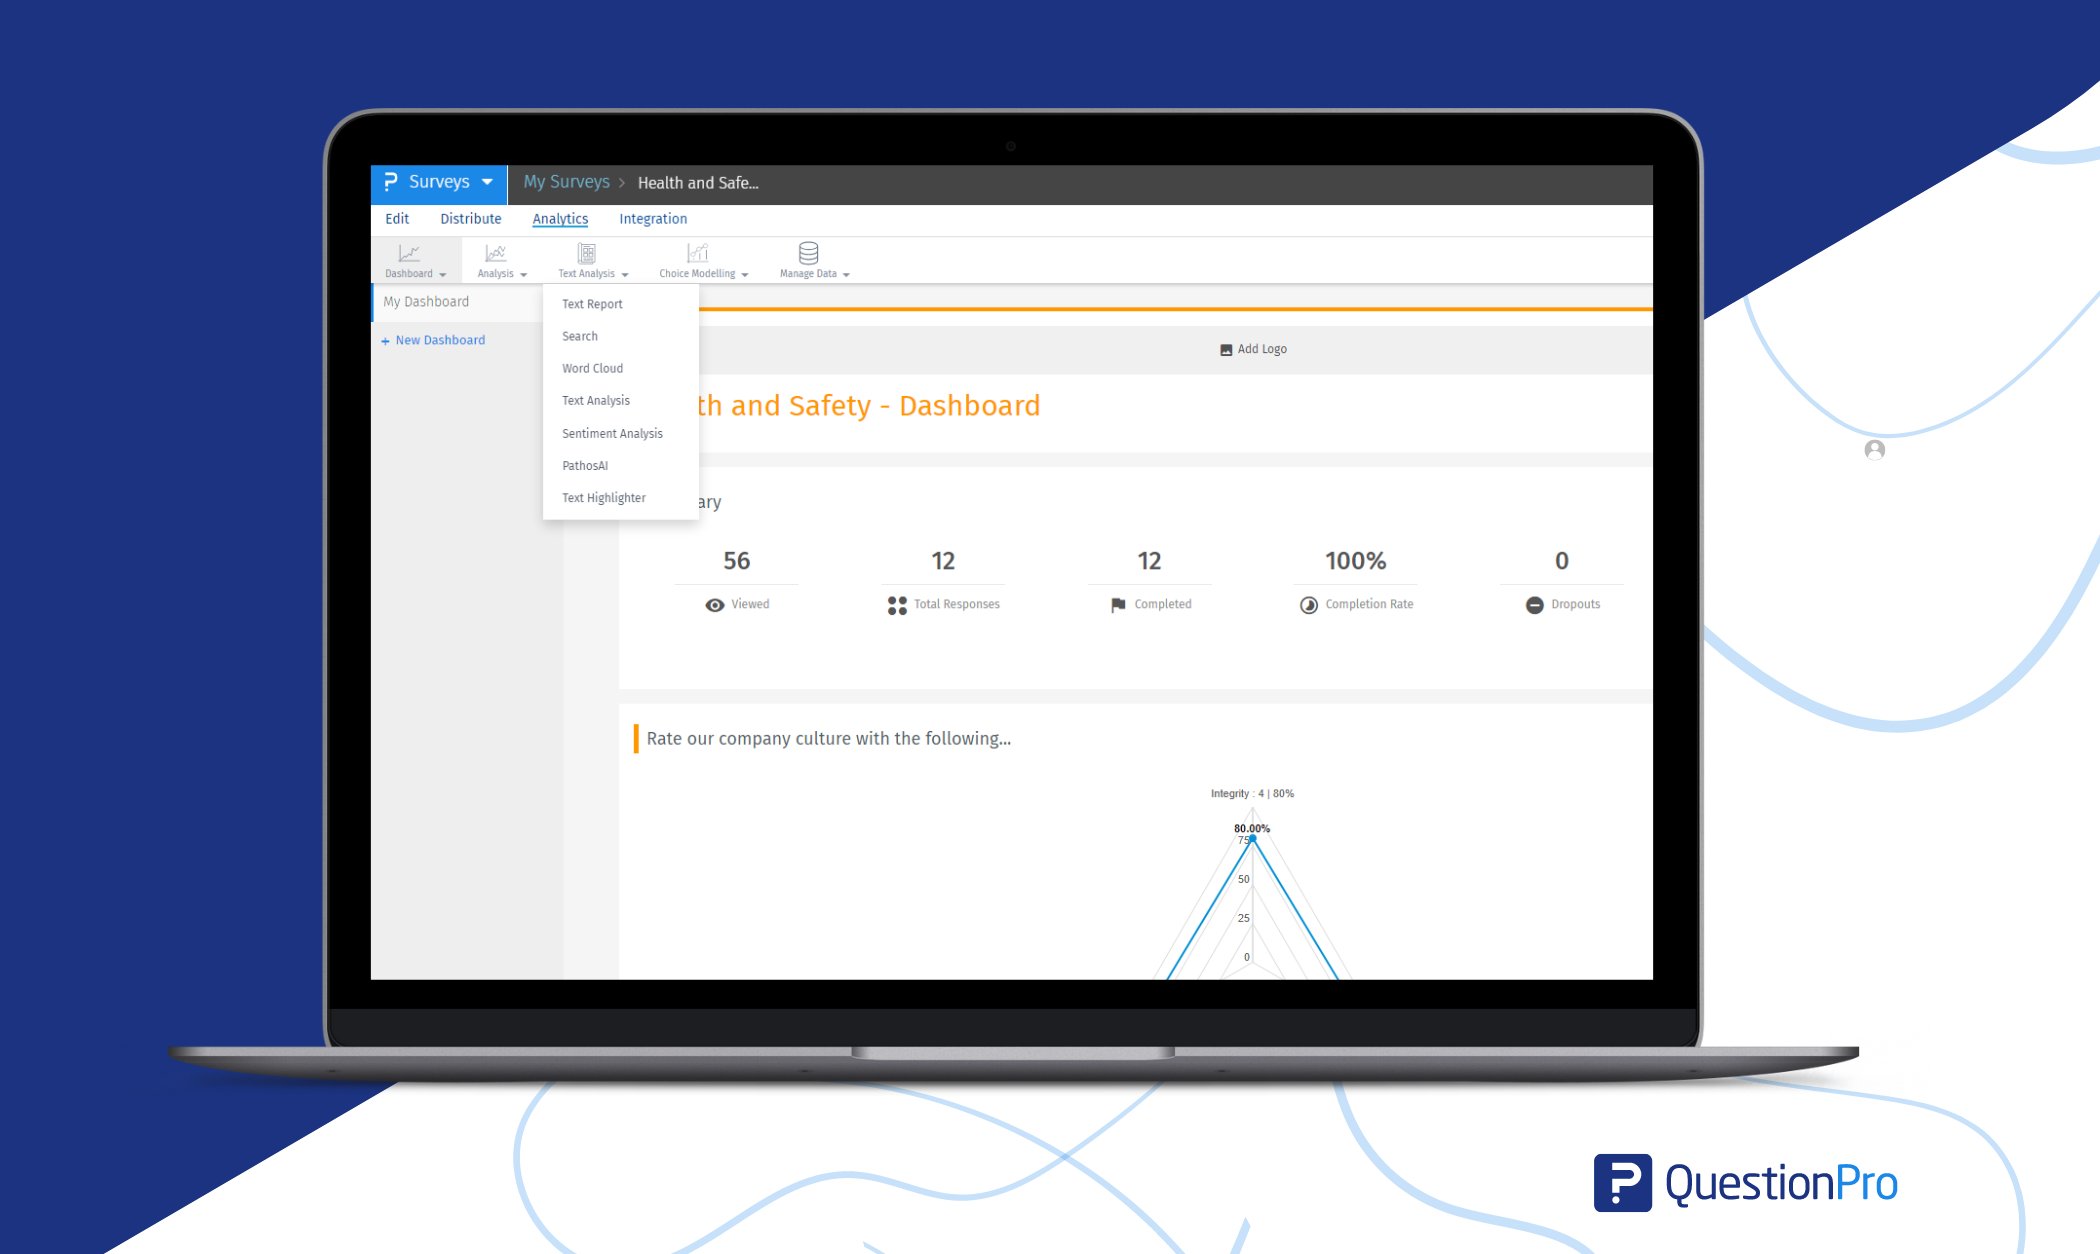
1. Easy-to-understand data visualization and analysis
One of QuestionPro’s key strengths is its ability to turn complex data into simple visuals. Users can create detailed graphs, charts, and dashboards that make it easier to understand patterns and trends at a glance. This is particularly useful for those working with large datasets and need quick insights.
2. Advanced text analysis tools
QuestionPro is excellent at analyzing z, making it valuable for processing open-ended survey responses or interview transcripts.
- It identifies themes in textual data.
- Extracts important keywords.
- Provides deeper insights into customer feedback.
3. Sentiment analysis for emotional insights
QuestionPro goes beyond words with its sentiment analysis feature. It helps users evaluate the emotional tone in textual data, showing how people feel about topics or products. You can:
- Track sentiment in real-time.
- Improve customer satisfaction metrics .
4. Word cloud for quick theme identification
QuestionPro offers a useful word cloud feature that shows the most common words in your data. This helps researchers quickly identify important themes and ideas.
This qualitative data analysis tool generates word clouds, which highlight frequently mentioned words, making it easier to see recurring topics or concerns. It’s a fast, visual way to recognize key themes without going through a lot of text manually.
The word cloud simplifies theme analysis, which allows you to quickly understand the main focus of your data without spending too much time on detailed coding.
5. Feedback analysis for open-ended responses
Open-ended responses can offer valuable insights, but they can be hard to analyze because they aren’t structured. QuestionPro helps by turning this kind of feedback into useful data.
Whether respondents share detailed suggestions or personal stories, QuestionPro can break down these responses to find key ideas to help improve business performance. By focusing on open-ended feedback, businesses can better understand what their customers think, what they like or dislike, and where improvements can be made.
These insights can help companies boost customer satisfaction, adjust their services, and make sure they’re meeting customer needs. This qualitative data analysis tool ensures researchers get the most out of their qualitative data, without missing any important details.
6. Image analysis for visual feedback
Beyond just text, QuestionPro also handles visual content such as images. This is especially helpful for industries that depend on visual feedback or multimedia.
For researchers working with image-based feedback, QuestionPro’s image analysis tool helps extract valuable insights from visual content, including customer photos and marketing images.
By combining image analysis with text, researchers will get a more detailed and comprehensive view of customer feedback. This makes it a great tool for any research involving multimedia data.
7. Seamless integrations for enhanced workflow
QuestionPro works smoothly with popular tools like Excel, Google Analytics, and social media platforms. This makes it easier to export and analyze data from different sources.
This integration helps teams collaborate better and keeps all the important data in one place, making research more efficient. By connecting with other tools, researchers can automate certain parts of the qualitative analysis process. This will save time for more in-depth insights and strategic planning.
QuestionPro’s qualitative data analysis software is one of the best solutions for researchers who are looking to gain deeper insights from their data. Its powerful visualization, qualitative text analysis, sentiment analysis, and feedback tools make it the ideal platform for mixed methods research.
If you’re looking for a powerful, user-friendly tool for qualitative analysis, QuestionPro is a top choice. Reach out to schedule a demo or learn more about how QuestionPro can transform your research process!
LEARN MORE FREE TRIAL
Frequently Asked Questions (FAQs)
Qualitative data analysis software helps researchers work with non-numerical data like text, audio, video, and images. It helps organize, code, and interpret this data to find patterns, themes, and insights.
To choose the right QDA software, consider factors such as your research needs, the type of data you will analyze, the software’s features and capabilities, ease of use, compatibility with other tools you use, and your budget. QuestionPro can be the best choice for you as it allows you to try out trial versions of different programs to determine which one best meets your needs.
Yes, QDA software like QuestionPro can handle mixed methods research. This platform allows researchers to work with both qualitative and quantitative data, making it easier to do a thorough analysis of their findings.
MORE LIKE THIS
Total Experience in Trinidad & Tobago — Tuesday CX Thoughts
Oct 29, 2024

You Can’t Please Everyone — Tuesday CX Thoughts
Oct 22, 2024

Life@QuestionPro Presents: Andrews Sekar
Oct 14, 2024
Edit survey: A new way of survey building and collaboration
Oct 10, 2024
Other categories
- Academic Research
- Artificial Intelligence
- Assessments
- Brand Awareness
- Case Studies
- Communities
- Consumer Insights
- Customer effort score
- Customer Engagement
- Customer Experience
- Customer Loyalty
- Customer Research
- Customer Satisfaction
- Employee Benefits
- Employee Engagement
- Employee Retention
- Friday Five
- General Data Protection Regulation
- Insights Hub
- Life@QuestionPro
- Market Research
- Mobile diaries
- Mobile Surveys
- New Features
- Online Communities
- Question Types
- Questionnaire
- QuestionPro Products
- Release Notes
- Research Tools and Apps
- Revenue at Risk
- Survey Templates
- Training Tips
- Tuesday CX Thoughts (TCXT)
- Uncategorized
- What’s Coming Up
- Workforce Intelligence
- Hire a PhD Guide
- Guidance Process
- PhD Topic and Proposal Help
- PhD Thesis Chapters Writing
- PhD Literature Review Writing Help
- PhD Research Methodology Chapter Help
- Questionnaire Design for PhD Research
- PhD Statistical Analysis Help
- Qualitative Analysis Help for PhD Research
- Software Implementation Help for PhD Projects
- Journal Paper Publication Assistance
- Addressing Comments, Revisions in PhD Thesis
- Enhance the Quality of Your PhD Thesis with Professional Thesis Editing Services
- PhD Thesis Defence Preparation
Ethical research guidance and consulting services for PhD candidates since 2008
Topic selection & proposal development, enquire now, software implementation using matlab, questionnaire designing & data analysis, chapters writing & journal papers, 12 unexplored data analysis tools for qualitative research.

Welcome to our guide on 5 lesser-known tools for studying information in a different way – specifically designed for understanding and interpreting data in qualitative research. Data analysis tools for qualitative research are specialized instruments designed to interpret non-numerical data, offering insights into patterns, themes, and relationships.
These tools enable researchers to uncover meaning from qualitative information, enhancing the depth and understanding of complex phenomena in fields such as social sciences, psychology, and humanities.
In the world of research, there are tools tailored for qualitative data analysis that can reveal hidden insights. This blog explores these tools, showcasing their unique features and advantages compared to the more commonly used quantitative analysis tools.
Whether you’re a seasoned researcher or just starting out, we aim to make these tools accessible and highlight how they can add depth and accuracy to your analysis. Join us as we uncover these innovative approaches, offering practical solutions to enhance your experience with qualitative research.
Tool 1:MAXQDA Analytics Pro

MAXQDA Analytics Pro emerges as a game-changing tool for qualitative data analysis, offering a seamless experience that goes beyond the capabilities of traditional quantitative tools.
Here’s how MAXQDA stands out in the world of qualitative research:
Advanced Coding and Text Analysis: MAXQDA empowers researchers with advanced coding features and text analysis tools, enabling the exploration of qualitative data with unprecedented depth. Its intuitive interface allows for efficient categorization and interpretation of textual information.
Intuitive Interface for Effortless Exploration: The user-friendly design of MAXQDA makes it accessible for researchers of all levels. This tool streamlines the process of exploring qualitative data, facilitating a more efficient and insightful analysis compared to traditional quantitative tools.
Uncovering Hidden Narratives: MAXQDA excels in revealing hidden narratives within qualitative data, allowing researchers to identify patterns, themes, and relationships that might be overlooked by conventional quantitative approaches. This capability adds a valuable layer to the analysis of complex phenomena.
In the landscape of qualitative data analysis tools, MAXQDA Analytics Pro is a valuable asset, providing researchers with a unique set of features that enhance the depth and precision of their analysis. Its contribution extends beyond the confines of quantitative analysis tools, making it an indispensable tool for those seeking innovative approaches to qualitative research.
Tool 2: Quirkos

Quirkos , positioned as data analysis software, shines as a transformative tool within the world of qualitative research.
Here’s why Quirkos is considered among the best for quality data analysis: Visual Approach for Enhanced Understanding: Quirkos introduces a visual approach, setting it apart from conventional analysis software. This unique feature aids researchers in easily grasping and interpreting qualitative data, promoting a more comprehensive understanding of complex information.
User-Friendly Interface: One of Quirkos’ standout features is its user-friendly interface. This makes it accessible to researchers of various skill levels, ensuring that the tool’s benefits are not limited to experienced users. Its simplicity adds to the appeal for those seeking the best quality data analysis software.
Effortless Pattern Identification: Quirkos simplifies the process of identifying patterns within qualitative data. This capability is crucial for researchers aiming to conduct in-depth analysis efficiently.
The tool’s intuitive design fosters a seamless exploration of data, making it an indispensable asset in the world of analysis software. Quirkos, recognized among the best quality data analysis software, offers a visual and user-friendly approach to qualitative research. Its ability to facilitate effortless pattern identification positions it as a valuable asset for researchers seeking optimal outcomes in their data analysis endeavors.
Tool 3: Provalis Research WordStat

Provalis Research WordStat stands out as a powerful tool within the world of qualitative data analysis tools, offering unique advantages for researchers engaged in qualitative analysis:
WordStat excels in text mining, providing researchers with a robust platform to delve into vast amounts of textual data. This capability enhances the depth of qualitative analysis, setting it apart in the landscape of tools for qualitative research.
Specializing in content analysis, WordStat facilitates the systematic examination of textual information. Researchers can uncover themes, trends, and patterns within qualitative data, contributing to a more comprehensive understanding of complex phenomena.
WordStat seamlessly integrates with qualitative research methodologies, providing a bridge between quantitative and qualitative analysis. This integration allows researchers to harness the strengths of both approaches, expanding the possibilities for nuanced insights.
In the domain of tools for qualitative research, Provalis Research WordStat emerges as a valuable asset. Its text mining capabilities, content analysis expertise, and integration with qualitative research methodologies collectively contribute to elevating the qualitative analysis experience for researchers.
Tool 4: ATLAS.ti

ATLAS.ti proves to be a cornerstone in the world of qualitative data analysis tools, offering distinctive advantages that enhance the qualitative analysis process:
Multi-Faceted Data Exploration: ATLAS.ti facilitates in-depth exploration of textual, graphical, and multimedia data. This versatility enables researchers to engage with diverse types of qualitative information, broadening the scope of analysis beyond traditional boundaries.
Collaboration and Project Management: The tool excels in fostering collaboration among researchers and project management. This collaborative aspect sets ATLAS.ti apart, making it a comprehensive solution for teams engaged in qualitative research endeavors.
User-Friendly Interface: ATLAS.ti provides a user-friendly interface, ensuring accessibility for researchers of various skill levels. This simplicity in navigation enhances the overall qualitative analysis experience, making it an effective tool for both seasoned researchers and those new to data analysis tools. In the landscape of tools for qualitative research, ATLAS.ti emerges as a valuable ally. Its multi-faceted data exploration, collaboration features, and user-friendly interface collectively contribute to enriching the qualitative analysis journey for researchers seeking a comprehensive and efficient solution.
Tool 5: NVivo Transcription

NVivo Transcription emerges as a valuable asset in the world of data analysis tools, seamlessly integrating transcription services with qualitative research methodologies:
Efficient Transcription Services: NVivo Transcription offers efficient and accurate transcription services, streamlining the process of converting spoken words into written text. This feature is essential for researchers engaged in qualitative analysis, ensuring a solid foundation for subsequent exploration.
Integration with NVivo Software: The tool seamlessly integrates with NVivo software, creating a synergistic relationship between transcription and qualitative analysis. Researchers benefit from a unified platform that simplifies the organization and analysis of qualitative data, enhancing the overall research workflow.
Comprehensive Qualitative Analysis: NVivo Transcription contributes to comprehensive qualitative analysis by providing a robust foundation for understanding and interpreting audio and video data. Researchers can uncover valuable insights within the transcribed content, enriching the qualitative analysis process.
In the landscape of tools for qualitative research, NVivo Transcription plays a crucial role in bridging the gap between transcription services and qualitative analysis. Its efficient transcription capabilities, integration with NVivo software, and support for comprehensive qualitative analysis make it a valuable tool for researchers seeking a streamlined and effective approach to handling qualitative data.
Tool 6: Dedoose
Web-Based Accessibility: Dedoose’s online platform allows PhD researchers to conduct qualitative data analysis from anywhere, promoting flexibility and collaboration.
Mixed-Methods Support: Dedoose accommodates mixed-methods research, enabling the integration of both quantitative and qualitative data for a comprehensive analysis.
Multi-Media Compatibility: The tool supports various data formats, including text, audio, and video, facilitating the analysis of diverse qualitative data types.
Collaborative Features: Dedoose fosters collaboration among researchers, providing tools for shared coding, annotation, and exploration of qualitative data.
Organized Data Management: PhD researchers benefit from Dedoose’s organizational features, streamlining the coding and retrieval of data for a more efficient analysis process.
Tool 7: HyperRESEARCH
HyperRESEARCH caters to various qualitative research methods, including content analysis and grounded theory, offering a flexible platform for PhD researchers.
The software simplifies the coding and retrieval of data, aiding researchers in organizing and analyzing qualitative information systematically.
HyperRESEARCH allows for detailed annotation of text, enhancing the depth of qualitative analysis and providing a comprehensive understanding of the data.
The tool provides features for visualizing relationships within data, aiding researchers in uncovering patterns and connections in qualitative content.
HyperRESEARCH facilitates collaborative research efforts, promoting teamwork and shared insights among PhD researchers.
Tool 8: MAXQDA Analytics Plus
Advanced Collaboration:
MAXQDA Analytics Plus enhances collaboration for PhD researchers with teamwork support, enabling multiple researchers to work seamlessly on qualitative data analysis.
Extended Visualization Tools:
The software offers advanced data visualization features, allowing researchers to create visual representations of qualitative data patterns for a more comprehensive understanding.
Efficient Workflow:
MAXQDA Analytics Plus streamlines the qualitative analysis workflow, providing tools that facilitate efficient coding, categorization, and interpretation of complex textual information.
Deeper Insight Integration:
Building upon MAXQDA Analytics Pro, MAXQDA Analytics Plus integrates additional features for a more nuanced qualitative analysis, empowering PhD researchers to gain deeper insights into their research data.
User-Friendly Interface:
The tool maintains a user-friendly interface, ensuring accessibility for researchers of various skill levels, contributing to an effective and efficient data analysis experience.
Tool 9: QDA Miner
Versatile Data Analysis: QDA Miner supports a wide range of qualitative research methodologies, accommodating diverse data types, including text, images, and multimedia, catering to the varied needs of PhD researchers.
Coding and Annotation Tools: The software provides robust coding and annotation features, facilitating a systematic organization and analysis of qualitative data for in-depth exploration.
Visual Data Exploration: QDA Miner includes visualization tools for researchers to analyze data patterns visually, aiding in the identification of themes and relationships within qualitative content.
User-Friendly Interface: With a user-friendly interface, QDA Miner ensures accessibility for researchers at different skill levels, contributing to a seamless and efficient qualitative data analysis experience.
Comprehensive Analysis Support: QDA Miner’s features contribute to a comprehensive analysis, offering PhD researchers a tool that integrates seamlessly into their qualitative research endeavors.
Tool 10: NVivo
NVivo supports diverse qualitative research methodologies, allowing PhD researchers to analyze text, images, audio, and video data for a comprehensive understanding.
The software aids researchers in organizing and categorizing qualitative data systematically, streamlining the coding and analysis process.
NVivo seamlessly integrates with various data formats, providing a unified platform for transcription services and qualitative analysis, simplifying the overall research workflow.
NVivo offers tools for visual representation, enabling researchers to create visual models that enhance the interpretation of qualitative data patterns and relationships.
NVivo Transcription integration ensures efficient handling of audio and video data, offering PhD researchers a comprehensive solution for qualitative data analysis.
Tool 11: Weft QDA
Open-Source Affordability: Weft QDA’s open-source nature makes it an affordable option for PhD researchers on a budget, providing cost-effective access to qualitative data analysis tools.
Simplicity for Beginners: With a straightforward interface, Weft QDA is user-friendly and ideal for researchers new to qualitative data analysis, offering basic coding and text analysis features.
Ease of Use: The tool simplifies the process of coding and analyzing qualitative data, making it accessible to researchers of varying skill levels and ensuring a smooth and efficient analysis experience.
Entry-Level Solution: Weft QDA serves as a suitable entry-level option, introducing PhD researchers to the fundamentals of qualitative data analysis without overwhelming complexity.
Basic Coding Features: While being simple, Weft QDA provides essential coding features, enabling researchers to organize and explore qualitative data effectively.
Tool 12: Transana
Transana specializes in the analysis of audio and video data, making it a valuable tool for PhD researchers engaged in qualitative studies with rich multimedia content.
The software streamlines the transcription process, aiding researchers in converting spoken words into written text, providing a foundation for subsequent qualitative analysis.
Transana allows for in-depth exploration of multimedia data, facilitating coding and analysis of visual and auditory aspects crucial to certain qualitative research projects.
With tools for transcribing and coding, Transana assists PhD researchers in organizing and categorizing qualitative data, promoting a structured and systematic approach to analysis.
Researchers benefit from Transana’s capabilities to uncover valuable insights within transcribed content, enriching the qualitative analysis process with a focus on visual and auditory dimensions.
Final Thoughts
In wrapping up our journey through 5 lesser-known data analysis tools for qualitative research, it’s clear these tools bring a breath of fresh air to the world of analysis. MAXQDA Analytics Pro, Quirkos, Provalis Research WordStat, ATLAS.ti, and NVivo Transcription each offer something unique, steering away from the usual quantitative analysis tools.
They go beyond, with MAXQDA’s advanced coding, Quirkos’ visual approach, WordStat’s text mining, ATLAS.ti’s multi-faceted data exploration, and NVivo Transcription’s seamless integration.
These tools aren’t just alternatives; they are untapped resources for qualitative research. As we bid adieu to the traditional quantitative tools, these unexplored gems beckon researchers to a world where hidden narratives and patterns are waiting to be discovered.
They don’t just add to the toolbox; they redefine how we approach and understand complex phenomena. In a world where research is evolving rapidly, these tools for qualitative research stand out as beacons of innovation and efficiency.
PhDGuidance is a website that provides customized solutions for PhD researchers in the field of qualitative analysis. They offer comprehensive guidance for research topics, thesis writing, and publishing. Their team of expert consultants helps researchers conduct copious research in areas such as social sciences, humanities, and more, aiming to provide a comprehensive understanding of the research problem.
PhDGuidance offers qualitative data analysis services to help researchers study the behavior of participants and observe them to analyze for the research work. They provide both manual thematic analysis and using NVivo for data collection. They also offer customized solutions for research design, data collection, literature review, language correction, analytical tools, and techniques for both qualitative and quantitative research projects.
Frequently Asked Questions
- What is the best free qualitative data analysis software?
When it comes to free qualitative data analysis software, one standout option is RQDA. RQDA, an open-source tool, provides a user-friendly platform for coding and analyzing textual data. Its compatibility with R, a statistical computing language, adds a layer of flexibility for those familiar with programming. Another notable mention is QDA Miner Lite, offering basic qualitative analysis features at no cost. While these free tools may not match the advanced capabilities of premium software, they serve as excellent starting points for individuals or small projects with budget constraints.
2. Which software is used to Analyse qualitative data?
For a more comprehensive qualitative data analysis experience, many researchers turn to premium tools like NVivo, MAXQDA, or ATLAS.ti. NVivo, in particular, stands out due to its user-friendly interface, robust coding capabilities, and integration with various data types, including audio and visual content. MAXQDA and ATLAS.ti also offer advanced features for qualitative data analysis, providing researchers with tools to explore, code, and interpret complex qualitative information effectively.
3. How can I Analyse my qualitative data?
Analyzing qualitative data involves a systematic approach to make sense of textual, visual, or audio information. Here’s a general guide:
Data Familiarization: Understand the context and content of your data through thorough reading or viewing.
Open Coding: Begin with open coding, identifying and labeling key concepts without preconceived categories.
Axial Coding: Organize codes into broader categories, establishing connections and relationships between them.
Selective Coding: Focus on the most significant codes, creating a narrative that tells the story of your data.
Constant Comparison: Continuously compare new data with existing codes to refine categories and ensure consistency.
Use of Software: Employ qualitative data analysis software, such as NVivo or MAXQDA, to facilitate coding, organization, and interpretation.
4. Is it worth using NVivo for qualitative data analysis?
The use of NVivo for qualitative data analysis depends on the specific needs of the researcher and the scale of the project. NVivo is worth considering for its versatility, user-friendly interface, and ability to handle diverse data types. It streamlines the coding process, facilitates collaboration, and offers in-depth analytical tools. However, its cost may be a consideration for individuals or smaller research projects. Researchers with complex data sets, especially those involving multimedia content, may find NVivo’s advanced features justify the investment.
5. What are the tools used in quantitative data analysis?
Quantitative data analysis relies on tools specifically designed to handle numerical data. Some widely used tools include:
SPSS (Statistical Package for the Social Sciences): A statistical software suite that facilitates data analysis through descriptive statistics, regression analysis, and more. Excel: Widely used for basic quantitative analysis, offering functions for calculations, charts, and statistical analysis.
R and RStudio: An open-source programming language and integrated development environment used for statistical computing and graphics.
Python with Pandas and NumPy: Python is a versatile programming language, and Pandas and NumPy are libraries that provide powerful tools for data manipulation and analysis.
STATA: A software suite for data management and statistical analysis, widely used in various fields.
Hence, the choice of qualitative data analysis software depends on factors like project scale, budget, and specific requirements. Free tools like RQDA and QDA Miner Lite offer viable options for smaller projects, while premium software such as NVivo, MAXQDA, and ATLAS.ti provide advanced features for more extensive research endeavors. When it comes to quantitative data analysis, SPSS, Excel, R, Python, and STATA are among the widely used tools, each offering unique strengths for numerical data interpretation. Ultimately, the selection should align with the researcher’s goals and the nature of the data being analyzed.
Recent Posts
- What Guides Your Research: Understanding Hypothesis v/s Research Questions Hypothesis , PhD Research May 29, 2024
- How to Choose Well Matched Research Methodologies in PhD in 2024 – 25 Research Methodology January 16, 2024
- 5 Different Types of Research Methodology for 2024 PhD Research January 9, 2024
- 12 UNEXPLORED Data Analysis Tools for Qualitative Research Qualitative Analysis January 4, 2024
- Separating Myth from Reality: The Scientific Rigor of Qualitative Research Topic and Proposal March 7, 2023
- Data Analysis
- PhD Research
- Qualitative Analysis
- Research Methodology
- Topic and Proposal
REQUEST CALL BACK
Quick links.
- PhD Guidance Maharashtra Trail
- Synopsis and Thesis Assistance
- Privacy Policy
- Terms of use
- Schedule Your Consultation Now
- Grievance Redressal
Information
- Geo Polymer for road construction
- Machine Learning for Image processing applications
- IoT and automation
- Concrete strength with changing flyash percentage
- Purchase regret prediction with Deep Learning
- Low Power VLSI
- Antenna design using HFSS
- PhD Planner
CONTACT DETAILS
- 022 4896 4199 (20 Lines)
- 0091 93102 29971
- [email protected]
- Copyright © 2008-2024 PhD Guidance All Rights Reserved.

Request Service Brochure

IMAGES
VIDEO
COMMENTS
The #1 qualitative data analysis software with the best AI integration. Streamline your data analysis with automatic transcription, powerful analysis tools, ease of use, and smart AI …
Our user-friendly qualitative data analysis software makes it easy to upload files and analyze data quickly and efficiently so that you can make the most out of your research. Quick and easy AI-powered coding
Qualitative data analysis software helps researchers, analysts, and professionals manage, organize, and analyze non-numerical or qualitative data. Qualitative data refers to: Descriptive and text-based information. Text …
10 Best Qualitative Data Analysis Software Shortlist. Here's my pick of the 10 best software from the 20 tools reviewed. 1. Thematic — Best for turning unstructured data into actionable insights. 2. MAXQDA — Best for …
NVivo is Lumivero's easy-to-use, collaborative qualitative analysis software that allows researchers to import, organize, explore, connect and collaborate on their data to reveal more significant insights from their qualitative data faster.
Explore the qualitative data analysis tools and learn about data analysis tools for qualitative research. Discover insights into quantitative analysis tools.